Just released: First data update for 2020

06 May 2021
The first main macroeconomic indicators for 2020 are now available for 23 CESEE countries in the wiiw Annual Database.
The first main macroeconomic indicators for 2020, released by national statistics providers and Eurostat, are now available for 23 CESEE countries in the wiiw Annual Database, which is undergoing continuous updates as soon as new data become available. Additionally, our useful visual analytics tool, the CESEE Visual Data Explorer with expanded data coverage, is now accessible exclusively to members for their own analysis. This is the first of the six updates we will spread throughout the year. These updates allow us to respond in a more timely way to releases of important data, and replace our Handbook of Statistics in 2021. The full dataset is available to members and data subscribers.
The economic consequences of the pandemic in CESEE in 2020: First results captured by preliminary data
On average, the CESEE region was not severely hit by economic contraction in 2020. A decline in real GDP of 2.3%, measured as a weighted average over the region, was less pronounced than the 5.6% drop in real GDP after the global financial crisis in 2009. However, the economic consequences of the coronavirus pandemic for individual countries varied substantially, from a 15.2% decline in real GDP in Montenegro to economic growth of 1.8% in Turkey, the only country in the region which recorded a positive economic performance in 2020. The EU-CEE sub-region suffered a larger drop in real GDP (3.9%) than the Western Balkans (3.1%) and the CIS and Ukraine (3%); all data expressed as weighted averages.
Annual real GDP growth in 2020, in %
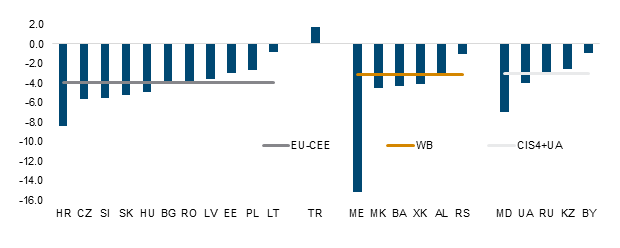
Sources: wiiw Annual Database incorporating national and Eurostat statistics; wiiw calculations. Navigation in the database tree: National accounts/Main indicators/Indicator: Gross domestic product total/Unit: real growth rate in %
Consumer demand dropped amid lockdowns and other mobility-restricting measures in most CESEE countries. However, the contribution of household consumption to GDP growth still remained positive in four countries of the region, Bulgaria, Ukraine, Turkey and Kosovo. In Latvia (-6 pp), Moldova (-5.5 pp) and Slovenia (-5 pp) a decline in household consumption made the strongest negative contribution to real GDP.
Contribution of household consumption to real GDP growth in 2020, in percentage points
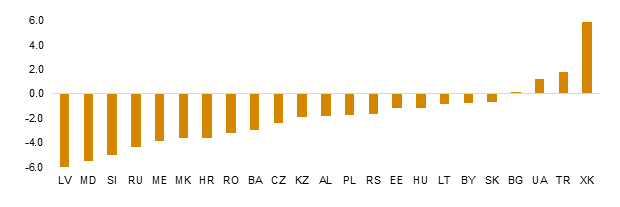
Source: wiiw Annual Database incorporating national and Eurostat statistics. Navigation in the database tree: National accounts/Gross domestic product by expenditures/Indicator: Household final consumption expenditure/Unit: contribution to GDP growth, percentage point change on previous period.
Data for the unemployment rate in 2020 point to a limited impact of the crisis on the labour markets, with only eight of the 23 CESEE economies posting an increase in this indicator of more than one percentage point last year. However, in an adjustment pattern on the labour market most of the countries recorded people moving into inactivity. The activity rate remained the same or increased only slightly in three CESEE countries: Romania (0 pp) and Latvia and Lithuania (both 0.5 pp). The steepest decline in the activity rate was observed in Montenegro (4.1 pp), Turkey (3.6 pp) and Moldova (2.0 pp), where this indicator was already low in a CESEE comparison in the past, reaching 53.4%, 49.3% and 40.3%, respectively, compared with a simple average in the CESEE region of 59% in 2020. Additional mechanisms of labour market adjustments in many countries were reduced working hours and special government policies aimed at preserving jobs.
Unemployment rate in 2019 and 2020, in %; annual change in percentage points in 2020
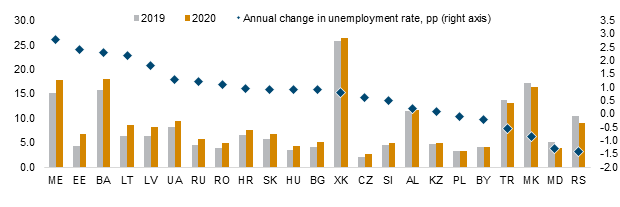
Note: Sorted in descending order by annual change in the unemployment rate in 2020.
Source: wiiw Annual Database, incorporating national and Eurostat statistics. Navigation in the database tree: Labour market/Labour force by labour force survey (LFS)/Labour force total/Indicator: Unemployment rate, LFS/Unit: in %, period average.
A heavy reliance on tourism was one of the factors determining the severity of the economic decline in 2020. Among the countries where this share exceeded 15% in the pre-crisis year 2019, exports of travel services dropped (in euro terms) by 56% in Croatia, 53% in Albania and 52% in Kosovo, whereas Montenegro lost almost all revenues from tourism (-87%), according to the first results for the balance of payment statistics. Not surprisingly, the deterioration of the current account as a percentage of GDP was largest in Montenegro (-0.9 pp) and less pronounced in Croatia, Kosovo and Albania (- 3.8pp, 1.4pp and 0.9pp, respectively).
Annual change in the current account balance, in % of GDP; and in exports of travel services, in % of GDP in 2020, in percentage points
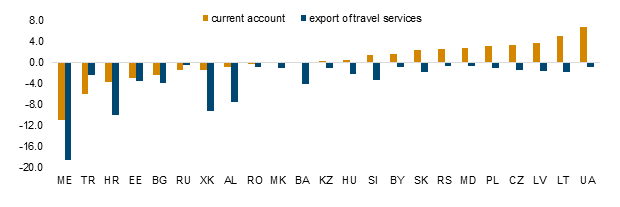
Note: Sorted in ascending order by annual change in the current account balance, in % of GDP in 2020.
Source: wiiw Annual Database incorporating national and Eurostat statistics. Navigation in the database tree: Foreign finance/Balance of payments/BOP - 6th edition/Indicators: 1. Current account balance and 1.A.b.4 Travel, credit/Unit: in % of GDP
Although all CESEE countries introduced counter-cyclical and anti-crisis fiscal measures in 2020, the amount of support and the sources of funding varied throughout the individual economies. Consequently, there are substantial variations in the level and the degree of change regarding the budget deficit and public debt as a percentage of GDP throughout the region. On average, budget deficits as a percentage of GDP, based on calculations in euro, were higher in the EU-CEE (7.1%) and the Western Balkans sub-region (6.9%), whereas Turkey (4.5%) and the CIS4 and Ukraine (4.1%) reported lower budget deficits than the CESEE average of 5.4%. Montenegro (105.1%), Croatia (89.1%) and Slovenia (80.8%) posted the highest public debt to GDP ratio among the 23 CESEE countries last year. Along with Hungary, they were also the top four countries with the highest annual change in this indicator, at above 15 percentage points. In Bulgaria, Kosovo, Estonia and Russia the public debt was still below 25% of GDP at the end of 2020. All countries except Turkey had a higher public debt to GDP ratio in 2020 than after the global financial crisis in 2009.
Public debt, in % of GDP, in 2009, 2019 and 2020
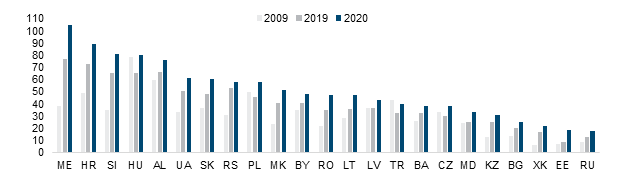
Note: Sorted in descending order by 2020 values.
Source: wiiw Annual Database incorporating national and Eurostat statistics. Navigation in the database tree: Domestic finance/Budget and public debt/Indicators: General government gross debt, total and general government budget, deficit (-) / surplus (+) /Unit: EUR m and in % of GDP
A more detailed analysis of the region, individual countries and forecasts for 2021-2023 can be found in the Spring 2021 wiiw Forecast Report ‘Darkest before the dawn?’.