Measuring China’s rise

09 October 2019
The US, the EU and China are the world’s biggest economies. With the People’s Republic of China celebrating its 70th anniversary, we review their changing global economic positioning.
The 1st of October constitutes the National Day of the People’s Republic of China. This year marked its 70th anniversary. Political topics were dominating public and private media responses in Europe, primarily related to:
- remembering the millions of victims of the mass starvation during the ‘Great Leap Forward’ campaign led by the Communist Party leader Mao Zedong during 1958-1962;
- China’s massive military parade with 15,000 military personnel, feeding discussions on geopolitics referring to China’s initiatives in the South China Sea, or the suppression of minorities (such as the mostly Muslim Uighurs in Xinjiang);
- increasingly violent protests in Hong Kong, with a protester being shot by the police on China’s National Day and protestors setting metro stations on fire. The protests do raise questions on the future of the ‘one country, two systems’ scheme that applies to Hong Kong and Macao, and whether they might potentially affect provinces like Taiwan.
Though acknowledging the importance of historical as well as present political topics voiced in course of this big anniversary, this article graphically presents a selection of key figures from the World Development Indicators (WDI) database to review the economic development of China over the last three decades (when China’s economy actually started to flourish after the reform towards ‘Socialism with Chinese characteristics’ by Den Xiaoping).
The bubble size of the following charts is in relation to the world total (e.g. population) or the world average (e.g. CO2 emissions per capita). The bubbles are therefore comparable across China, the EU and the US, as well as in relation to the rest of the world over time, which is particularly interesting in light of the allegedly ongoing economic and military competition among the biggest economies in the world.
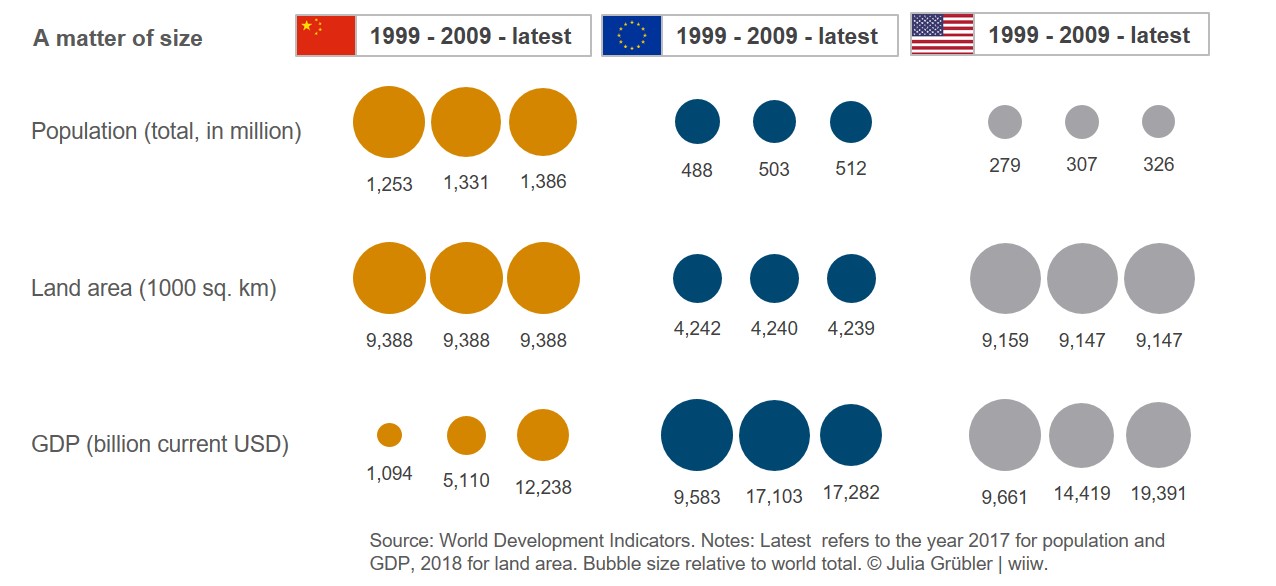
A matter of size
China is often referred to as the second largest economy in the world. Is it? In population size it is definitely leading the world ranking with more than one and approaching 1.5 billion citizens, followed by India and – with a big gap – by the US. China and the US are more similar in land area, globally ranked third and fourth, respectively (after Russia and Canada), being more than twice as big as the EU.
The most frequently used indicator for economic size is the gross domestic product (GDP), showing the value of goods and services produced. It is worth taking a closer look at these bubbles: First, given that the European Union is one single market, the EU actually is the second largest economy in the world with respect to GDP. Second, the increase of the Chinese economy is stunning, yet, its size is still far off the US level, in particular when considering the four times bigger population size. Third, although the economic output of the EU and the US is growing, their bubbles (i.e. the shares in world GDP) are shrinking, with other developing countries and emerging markets growing faster.
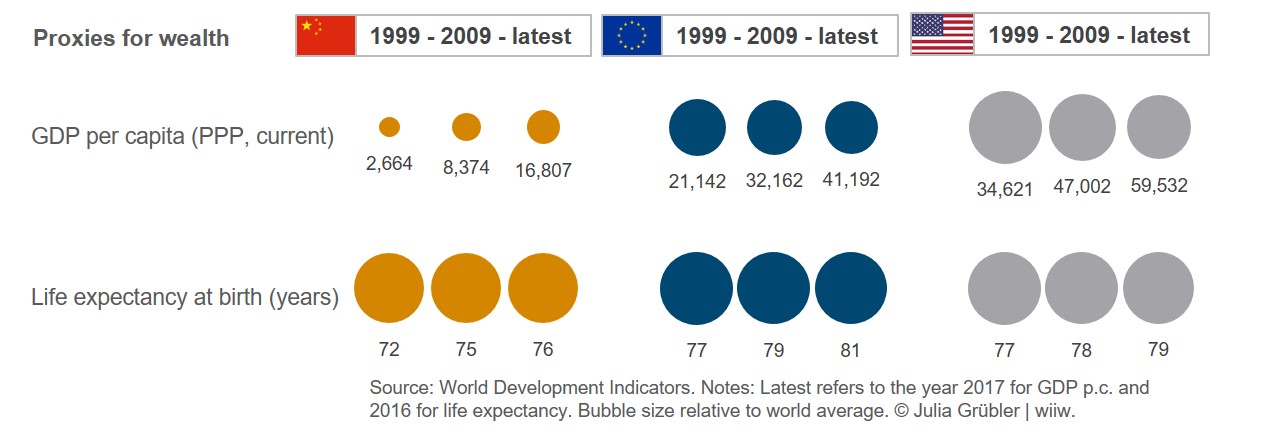
Size does not imply wealth
The race for the status of the world’s biggest economy (or biggest GDP) relatively frequently pops up in the media. More seldom, total economic output is set in relation to its population. GDP per capita corrected by different price levels and thus costs of living (termed “at purchasing power parities”, PPP) for China was not growing as fast as its total GDP. Considering this indicator, even today the US is three times as wealthy as China.
GDP and income are important indicators, but obviously not sufficient to judge how well-off countries’ citizens are. The educational system, the health care system and related out-of-pocket payments, retirement schemes, people’s rights and public infrastructure are just a few dimensions which would have to be considered. One non-monetary indicator for wellbeing is life expectancy at birth, which has been above the world average for all three economies. In 2016, worldwide life expectancy averaged 72 years. In the EU we can consider ourselves lucky to live on average 9 years longer; 7 years in the US and 4 years in China.
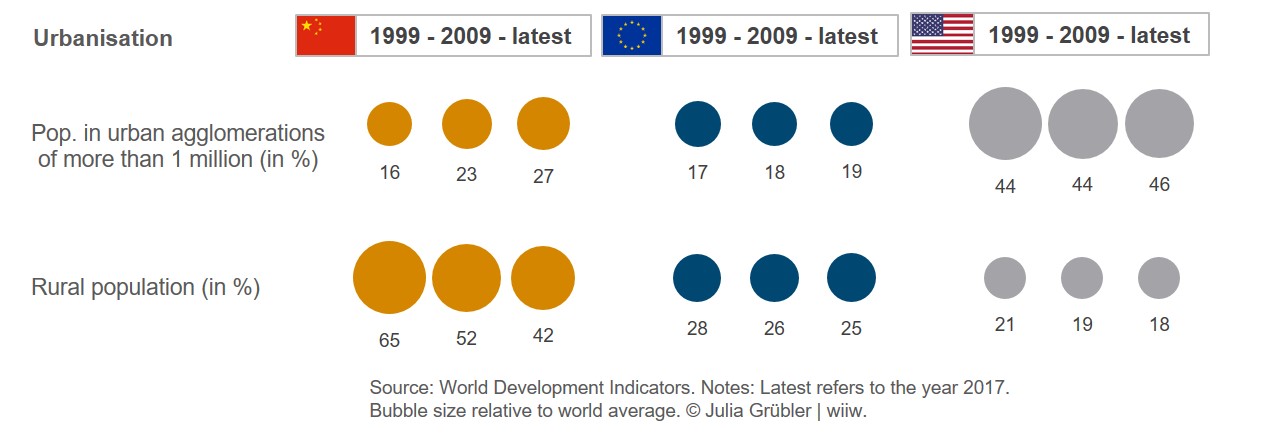
Both the US and China – despite their different backgrounds as capitalist versus socialist economies – are characterised by high and growing intra-country inequalities. Regionally, wealth is concentrated in both countries along coastal, urban regions, while economic growth and better living conditions do not reach the interior to the same extent.
Six of the 30 largest urban agglomeration areas in the world are found in China (Shanghai, Beijing, Chongqing, Tianjin, Guangzhou and Shenzhen), while the US (Los Angeles-Long Beach-Santa Ana) and the EU (Paris) are represented only once in the top-30. Nonetheless, the share of rural population is still much higher in China than in the EU or the US.
Unwanted side-effects of economic growth
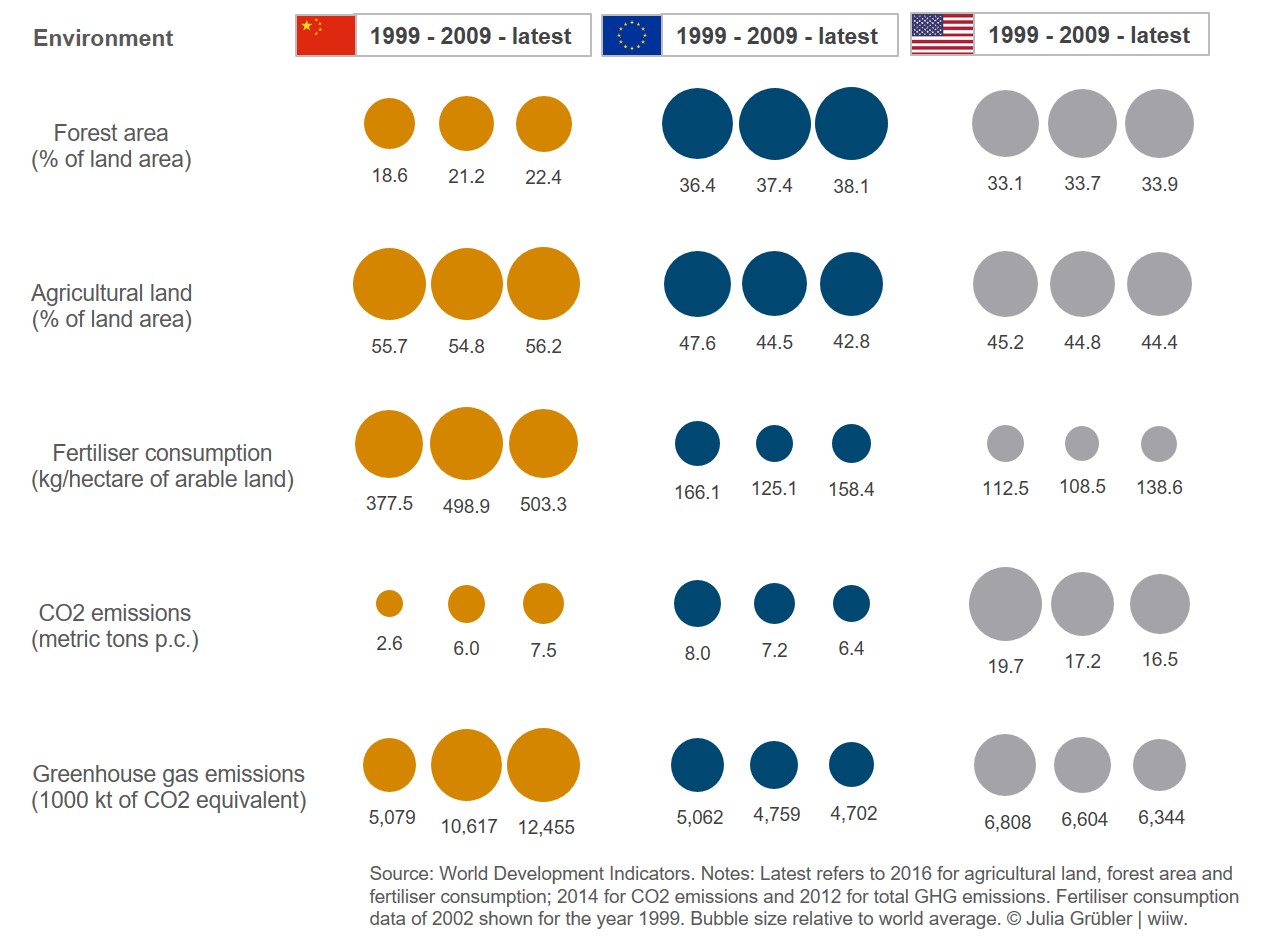
Economic and population growth typically affect the environment and climate negatively. Forest areas decrease (as more than 26,000 fires in the Amazon in Brazil’s Amazon have once more shown this summer). For the three biggest economies they are currently slowly growing and cover a fifth of the Chinese and more than a third of the US and EU land area. The share of land area used for the agricultural sector is throughout bigger than forest areas’ shares.
Apart from deforestation, agriculture can affect the environment negatively through water pollution (e.g. with nitrates or pesticides), greenhouse gases (e.g. methane) and loss of biodiversity (e.g. through overfishing). China stands out with its extraordinarily high level of fertiliser consumption (>500 kg per hectare of arable land compared to 158 kg for the EU or 139 kg for the US). However, numbers started to decrease during the last years, with a research project advising 21 million Chinese farmers resulting in increased crop yields by 11% and simultaneously a reduction of fertiliser use by 15%, saving 1.2 million tonnes of nitrogen and 12.2 USD costs for farmers.
Similar to public GDP comparisons, total emissions within national borders are publicly compared, pointing out that China is the biggest emitter of greenhouse gas emissions. Naturally, it’s the biggest and most populous countries showing the highest absolute greenhouse gas emissions. Unfortunately, WDI figures shown for greenhouse gas emissions refer to the year 2012 and those for CO2 emissions to 2014. Back then, CO2 emission levels per person between China and the EU were comparable while they were more than twice as high for the US.
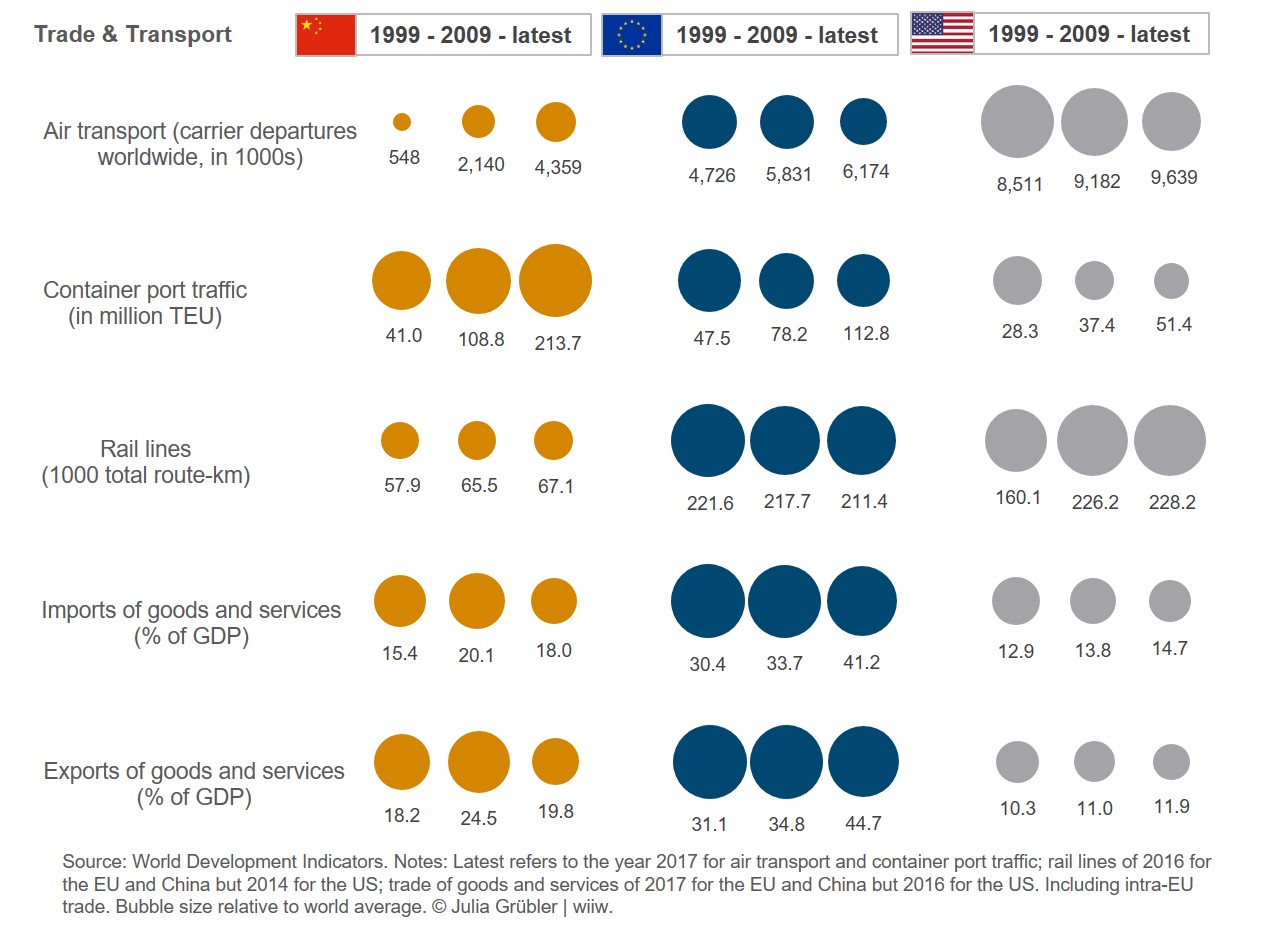
Growing importance of the transport sector
Greenhouse gases are to an increasing degree attributable to the transport sector. The EU is dominating the chart on trade figures and transport infrastructure, given its importance for the three out of four freedoms of the EU Single Market: the free movement of goods, services and labour, and related hereto the significance of intra-EU trade, which is not singled out in the graph.
In 1990, the share of EU-28 greenhouse gases attributable to the energy industries was 40%, while manufacturing and construction as well as the transport sector accounted for 20% each. By 2016, the share of manufacturing decreased to 14% while the energy and transport industries are almost equally important with 35% and 32%, respectively.
Within the transport sector of the EU, the biggest increases are observable for the aviation sector. Greenhouse gas contributions of railways, maritime and waterway transport decreased slightly, but road transportation remains the major source for transport-related greenhouse gas emissions (72%).
In 2017, the US recorded 50% more flight departures than the EU and more than twice as many as China. The picture reverses for maritime traffic, with more than 200 million twenty-foot equivalent units (TEU; a measure for a standard-sized container) having been transferred from land to sea transport modes or vice versa in China. Port traffic of the EU and the US amounted to about half and a quarter of the Chinese level, respectively. Remembering that the land area of the EU is only half the size of the US or China, it shows the densest network of railway lines. However, the trend is not comforting, with the EU’s share of road transport increasing and accounting for more than 75% of freight transport and more than 90% of inland passenger transport.
Modal shifts away from still fossil fuel based road traffic and air transport towards cleaner modes of transport are and will be a central challenge for all three economies.
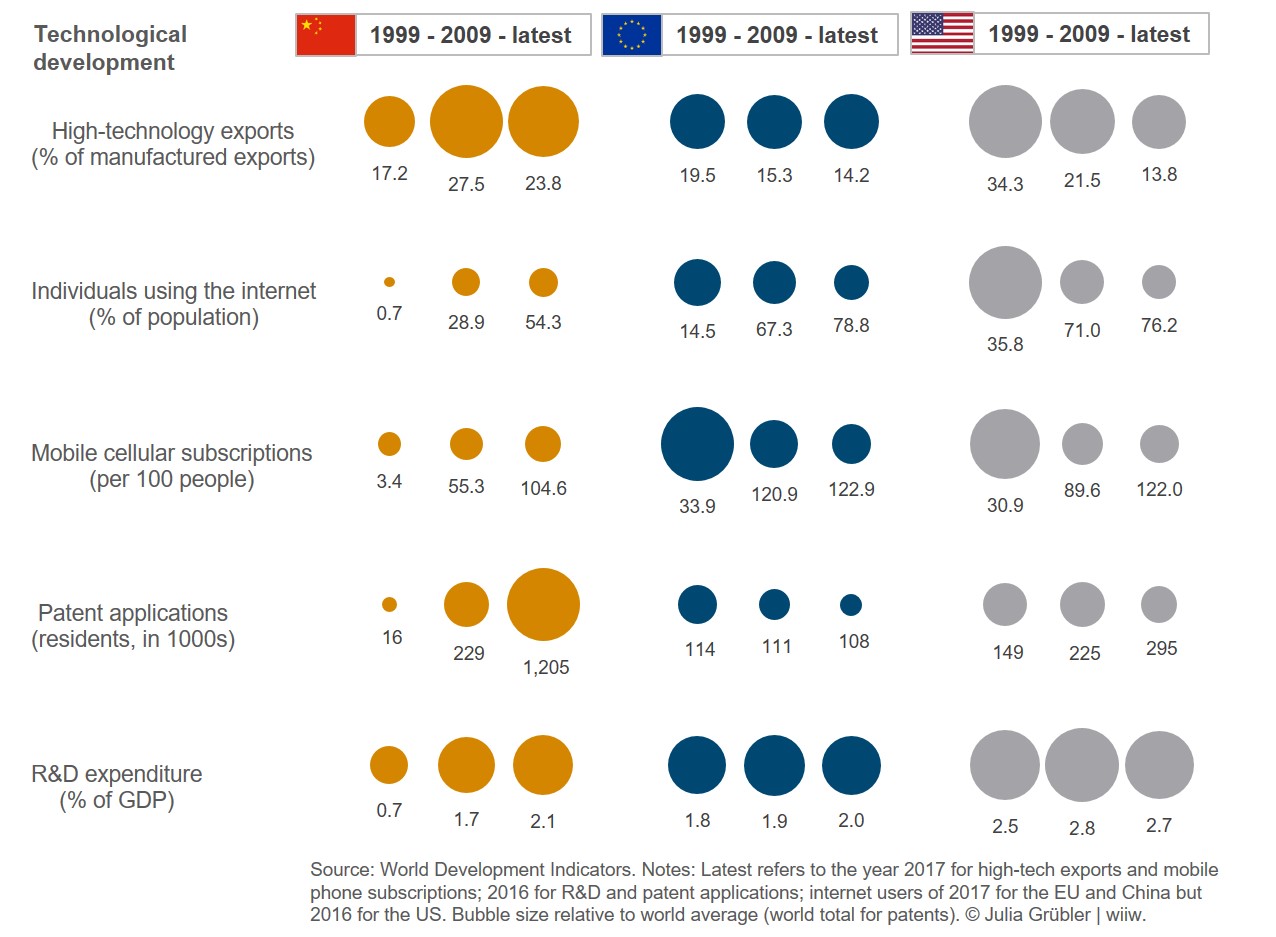
The digitalising knowledge economy as potential game changer
Back in 1999, the US showed the highest share of high-tech exports in their total manufacturing exports, the highest share of individuals using the internet, the highest number of patent applications, the highest spending on research and development (R&D) and a similar number of mobile phone subscriptions as the EU. The picture was very different for China, being dwarfed by the US.
Looking at the figures today, one might argue that it probably won’t take long for China to catch up with the EU and the US with respect to the density of internet users and mobile phone subscriptions (with the latter exceeding 100 subscriptions per 100 people for all three economies). More strikingly, though, is that China managed to leapfrog in the knowledge economy, showing R&D spending in percent of GDP similar to EU and US levels and surpassing them in the number of patent applications and specialisation in high-tech exports.
Economic and political powers will continue to change
Chinas economic development over the last 30 years has been impressive. Today, it rivals the EU and the US in many respects. Unfortunately, its economic success – though in per capita terms by far not being yet as wealthy as the US – triggered a feeling for competition, leading and fostering the ‘trade war’ between the US and China. This political divergence might become even tighter with China’s increasing economic impact through the expansion of its Belt and Road Initiative (BRI) and the global development of the digital economy.
What the world needs, however, is cooperation among the biggest and economically most powerful economies to tackle global challenges, with climate change being a particularly pressing one. Confrontations with the US in the fields of trade and environmental protection should not keep the EU, China and other economies from seeking opportunities for cooperation.