An Anatomy of the Global Trade Slowdown based on the WIOD 2016 Release

09 November 2016
wiiw and the GGDC updated the World Input-Output Database to analyse the slowdown in the global trade-to-GDP ratio based on a novel measure of international production fragmentation.
by Robert Stehrer, wiiw Scientific Director
The deceleration of international trade since 2011 has been widely documented and discussed. It is clear that the overall weakness in global economic activity is a major determinant. But there are also indications that the relationship between trade and GDP growth is undergoing a fundamental shift. This is evidenced by the trend in import intensity of world GDP (see Figure 1).
Figure 1 Import of goods and services (as percentage of global GDP)
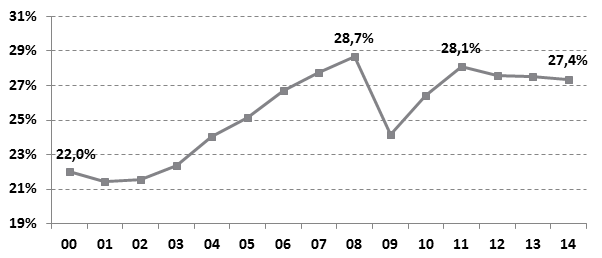
Note: Own calculations based on the World Input-Output Database (WIOD), 2016 release. This release covers all trade between forty-three countries as well as with a “rest-of-the-world” region. Imports and GDP are in current US$.
Figure 1 shows that it grew during the 2000s, then dropped dramatically in 2008-2009 (the ‘great trade collapse’) and recovered afterwards. In recent years, however, trade did not keep pace with world GDP, which is reflected in a slight but prolonged decline of the import intensity. Is this declining trend only a temporary phenomenon or is it the ‘new normal’? How much is due to a reversal of the trend in offshoring observed before the crisis? And how much is due to changing demand structures such as decreasing demand for durable investment and consumer goods, or sluggish growth in trade-intensive EU countries?
To shed light on these questions, the Vienna Institute for International Economic Studies (wiiw) together with the Groningen Growth and Development Centre have developed an update of the World Input-Output Database (WIOD). This new 2016 release provides an annual time-series of world input-output tables from 2000 to 2014 (compared to 1995-2011 in the 2013 release of WIOD). It covers forty-three countries (forty in the 2013 release), including all twenty-eight members of the European Union (as of July 1, 2013) and fifteen other major economies: Australia, Brazil, Canada, China, India, Indonesia, Japan, Mexico, Norway, Russia, South Korea, Switzerland, Taiwan, Turkey and the United States. The new release includes data on 56 sectors and products mainly at the 2-digit ISIC revision 4 level (or groups thereof) together covering the overall economy.
In the accompanying paper a consistent framework that quantifies the relative importance of potential determinants of the declining trend in the trade-to-GDP ratio is developed. A central concept in this approach is the global import intensity (GII) of production. This provides a novel measure of fragmentation which traces the imports needed in all stages of production. The increase in the GII during the period 2000-2008 was due to a combination of two forces: high demand for goods and continuous international production fragmentation fostering trade and GDP growth. Since 2011 fragmentation halted. Moreover, demand shifted to services which are less trade intensive than goods, in particular in China. It is argued that trade-to-GDP ratios are likely to remain stable in the near future.