30 years of Ukrainian independence: Is there a cause for optimism?
29 December 2021
Although Ukraine’s economic growth has been sluggish, in terms of democratic transformation it has scored better than many of its peers.
By Olga Pindyuk
Photo credit: istockphoto.com/MarcNim
- The social costs of transition were particularly high in Ukraine, as the country went through a dramatic population decline and a worsening of living standards. However, looking only at economic growth would greatly simplify the story of transition – it is also important to assess the level of democratic transformation in the country.
- Democratic institutions have developed much more strongly in Ukraine than in Belarus, Kazakhstan and Russia. There have been multiple reasons for these developments: the oligarchic clans have been the main bottom-up forces behind institution building, in contrast to the authoritarian leaders in other countries; the second-best policy anchors, such as the EU Association Agreement and cooperation with the IMF, have stimulated the reform progress; and Russia’s military aggression in Ukraine has turned out to be a catalyst for the promotion of society’s support for reforms.
- The Russia factor could be seen as a blessing in disguise in the long run, as it promotes faster economic restructuring to decrease Ukraine’s dependence on the Russian economy. The upsides of losing a big part of the industrial core of the economy have been the growing specialisation in computer services and the significant shift towards the digitalisation of the economy.
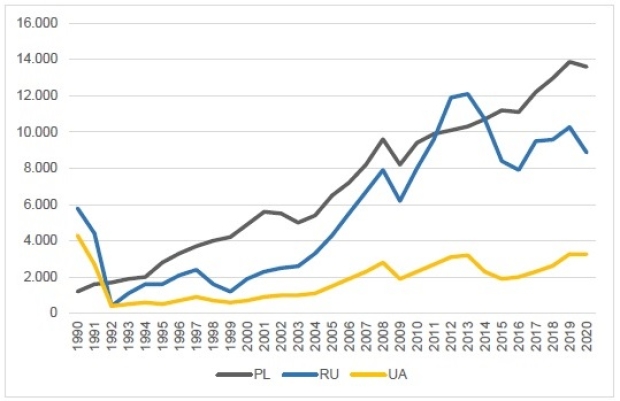
The 30-year-long path of Ukraine’s transition to a democratic market economy has not been smooth and easy: there have been many ups and downs, sudden stops and U-turns, enthusiasm and desperation. The social costs of transition were particularly high, as the country went through a dramatic population decline and a worsening of living standards. If one looks at the state of the country’s economy in 2020 (Figure 1), it would be easy to write Ukraine off as a transition failure: its GDP per capita in 2020 was lower than in 1990, significantly lagging behind that of Poland and Russia (and most other former USSR members).
Figure 1. GDP per capita, in EUR*
Note: *Up to 1998 ECU, EUR thereafter; PL – Poland, RU – Russia, UA – Ukraine
Source: wiiw Annual Database
It is important to acknowledge that corruption and a lack of reforms are not the only reasons for the meagre economic performance: the most devastating blow to Ukraine in the last 30 years came in 2014, with Russia invading and annexing Crimea and instigating military clashes in the Donbass and Luhansk regions, the industrial core of the country. The war in Donbass has been ongoing for more than seven years now and has so far resulted in the deaths of more than 13,000 people. As a result, the Ukrainian economy experienced a painful shock that caused a double-digit drop in GDP in 2014-2015, a massive currency depreciation and accelerating inflation.
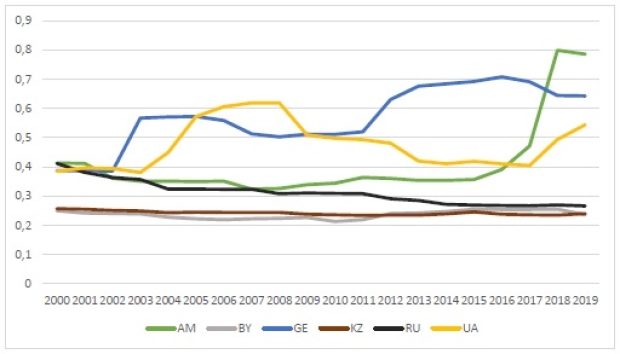
However, looking only at this indicator would greatly simplify the story – it is also important to assess the level of democratic transformation, as the development of institutions is crucial for the long-term chances of socioeconomic success. As can be seen from Figure 2, democratic institutions as measured by the Electoral Democracy Index have developed much more strongly in Ukraine (as well as in Georgia and Armenia) than in Belarus, Kazakhstan and Russia. In terms of electoral democracy, in 2019 Ukraine outperformed not only most of its peers from the former USSR but also Hungary and Serbia. There are multiple reasons for these developments:
- The oligarchic clans, which are sectoral and regional rivals, have been the main bottom-up forces behind institution building – and this is absent in the authoritarian regimes depicted in Figure 2.
- The second-best policy anchors, such as the EU-Ukraine Association Agreement and cooperation with the IMF, though not as effective as a promise of EU accession, have still supported the reform process.
- Russia’s military aggression in Ukraine has turned out to be a catalyst for the signing of an Association Agreement with the EU (and creating the Deep and Comprehensive Free Trade Area with the EU), and, most importantly, of healing social divides and promoting society’s support for reforms.
Figure 2. Electoral Democracy Index
Note: AM – Armenia, BY – Belarus, GE – Georgia, KZ – Kazakhstan, RU – Russia, UA – Ukraine; Index values range between 0 and 1, with 1 indicating the maximum electoral democracy.
Source: University of Gothenburg, V-Dem Institute
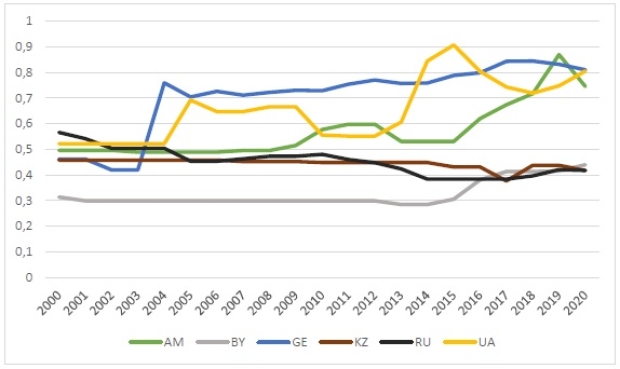
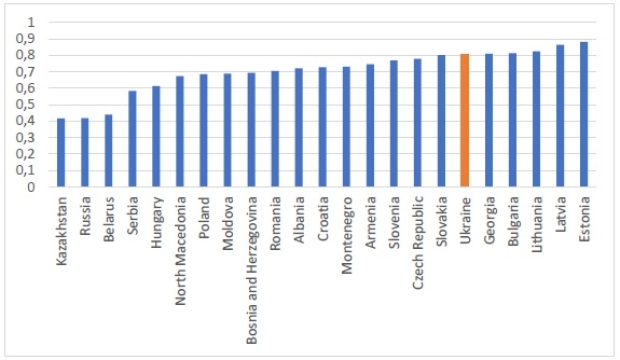
An even stronger divergence of trends can be seen in the civil society formation of these countries. According to the Civil Society Participation Index, Ukraine, together with Armenia and Georgia, has reached the level of civil participation that is higher than in most of the CESEE countries (Figures 3 and 4). The spikes of the index values around the dates of the colour revolutions (Rose Revolution in Georgia in 2003, Orange Revolution in Ukraine in 2004 and Velvet Revolution in Armenia in 2018) as well as the Revolution of Dignity in Ukraine in 2014 suggest the possible impact of mass protests on the formation of civil society in these countries.
Figure 3. Index of Civil Society Participation
Note: AM – Armenia, BY – Belarus, GE – Georgia, KZ – Kazakhstan, RU – Russia, UA – Ukraine; Index values range between 0 and 1, with 1 indicating the maximum civil society participation.
Source: University of Gothenburg, V-Dem Institute
Figure 4. Index of Civil Society Participation in 2020
Note: Index values range between 0 and 1, with 1 indicating the maximum civil society participation.
Source: University of Gothenburg, V-Dem Institute
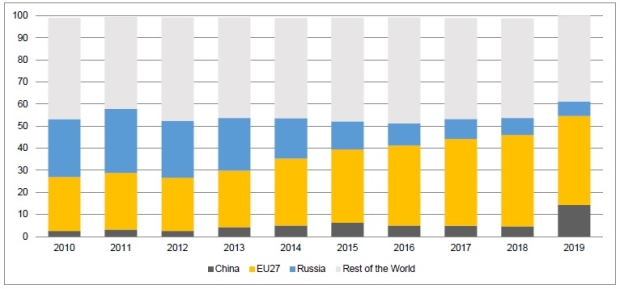
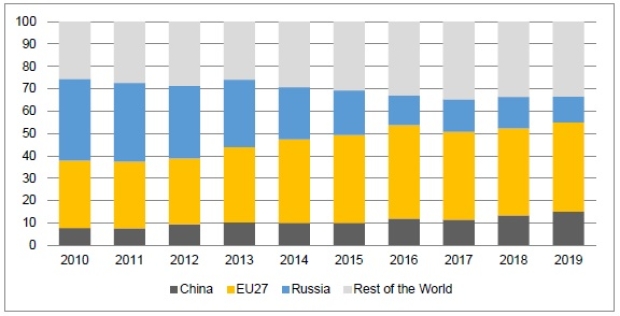
Although the Russia factor makes entrenching progress towards democratisation more difficult for Ukraine than for many other countries in the EU orbit, it could also be seen as a blessing in disguise in the long run, as it promotes faster economic restructuring to decrease dependence on the Russian economy. Figures 5 and 6 show how the geographical structure of Ukraine’s merchandise trade has changed in the wake of the Crimea annexation and the onset of the Donbas military conflict. Russia’s share in Ukraine’s exports decreased from 23.8% in 2013 to 6.5% in 2019, while in imports the relevant indicators were 30.2% and 11.5%, respectively. The EU has become the major destination for the country’s exports and source of its imports.
Figure 5: Ukraine’s export partners
Source: wiiw calculations based on UN Comtrade Database.
Figure 6: Ukraine’s import partners
Source: wiiw calculations based on UN Comtrade Database.
One upside to losing a big part of the industrial core of the economy has been the growing specialisation in computer services – in 2019 computer services accounted for 24.1% of Ukraine’s services exports (equivalent of 3.3% of GDP), which is 18.4 percentage points higher than in 2013. Moreover, there has been a significant shift towards digitalisation in the economy, with the share of digitally deliverable services in total services exports growing at the fastest rate in the CESEE region, reaching the level of the Visegrád countries.
The medium-term prospects of the economy depend to a large extent on substantial investment in new technologies and on the government’s ability to advance digitalisation.1) To achieve this, it will be crucial for the government to continue with its comprehensive reform agenda, and especially to overcome the high levels of corruption and the vast influence of vested interests.
Footnotes:
1) Pindyuk, O., The Ukrainian Economy: Is there a Reason for Optimism?', in: Peter W. Schultze and Winfried Veit (eds), Ukraine in the crosshairs of geopolitical power, Campus Verlag, Frankfurt / New York, 2020

