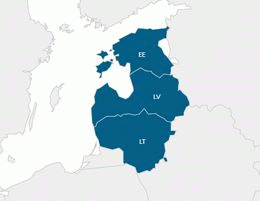
Baltic States

| FORECAST* | ||||||
|---|---|---|---|---|---|---|
| Main Economic Indicators | 2022 | 2023 | 2024 | 2025 | 2026 | 2027 |
| Population, 1000 persons | 6060 | 6126 | 6127 | . | . | . |
| GDP, real change in % | 1.5 | 0.3 | 1.3 | 2.2 | 2.3 | 2.4 |
| GDP per capita (EUR at PPP) | 29200 | 30620 | 32010 | . | . | . |
| Gross industrial production, real change in % | 3.6 | -6.3 | . | . | . | . |
| Unemployment rate - LFS, in %, average | 6.1 | 6.6 | 7.1 | 7.0 | 6.5 | 6.1 |
| Average gross monthly wages, EUR | 1632 | 1832 | 2011 | . | . | . |
| Consumer prices, % p.a. | 18.6 | 8.9 | 1.6 | 3.9 | 3.0 | 2.7 |
| Fiscal balance in % of GDP | -1.9 | -1.7 | -1.5 | -3.1 | -2.8 | -2.5 |
| Public debt in % of GDP | 34.8 | 34.9 | 36.7 | 38.2 | 37.4 | 36.8 |
| Current account in % of GDP | -5.2 | -0.8 | 0.9 | 0.4 | 0.1 | -0.1 |
| FDI inflow, EUR m | 5248 | 9897 | 2534 | . | . | . |
| Gross external debt in % of GDP | 82.5 | 82.6 | 88.2 | 85.3 | 86.6 | 83.6 |
Basic data are continuously updated.
* Forecasts are changed beginning of January, April, July and November.
See Press Conferences.
Monthly Report No. 10/2011
Doris Hanzl-Weiss, Gabor Hunya, Sebastian Leitner, Anton Mihailov, Leon Podkaminer, Sandor Richter and Hermine Vidovic
wiiw Monthly Report No. 10, October 2011
46 pages including 20 Tables
