EU growth remains weak and is increasingly labour-driven
01 October 2026
Growth and productivity in the EU continue to slow. Growth is increasingly driven by more people working rather than each hour worked producing more. This points to a widening investment gap, as our updated Growth and Productivity Database shows
image credit: unsplash.com/ThisisEngineering
By Robert Stehrer, Sebastian Drazsky, and David Zenz
- The growth and productivity slowdown in the EU continues: value added growth fell from 2.2% a year (1995-2008) to 1.5% (2012-2019) and 1.2% (2020-2024), and labour productivity growth fell from 1.3% to 0.5%.
- Remaining growth is increasingly driven by employment and less by total factor productivity growth and capital accumulation.
- Capital deepening has turned negative in 12 of 27 EU member states since 2020, up from three before the financial crisis.
- These results point to the investment gap identified in the Draghi and Letta reports and underline the importance of the Commission’s Savings and Investments Union.
- Given looming demographic pressures and falling hours per worker, a labour-driven growth model has clear limits and may not be sustainable in the longer run.
- These results are based on an update of the wiiw Growth and Productivity Database, now covering the period up to 2024.
The growth and productivity slowdown is continuing
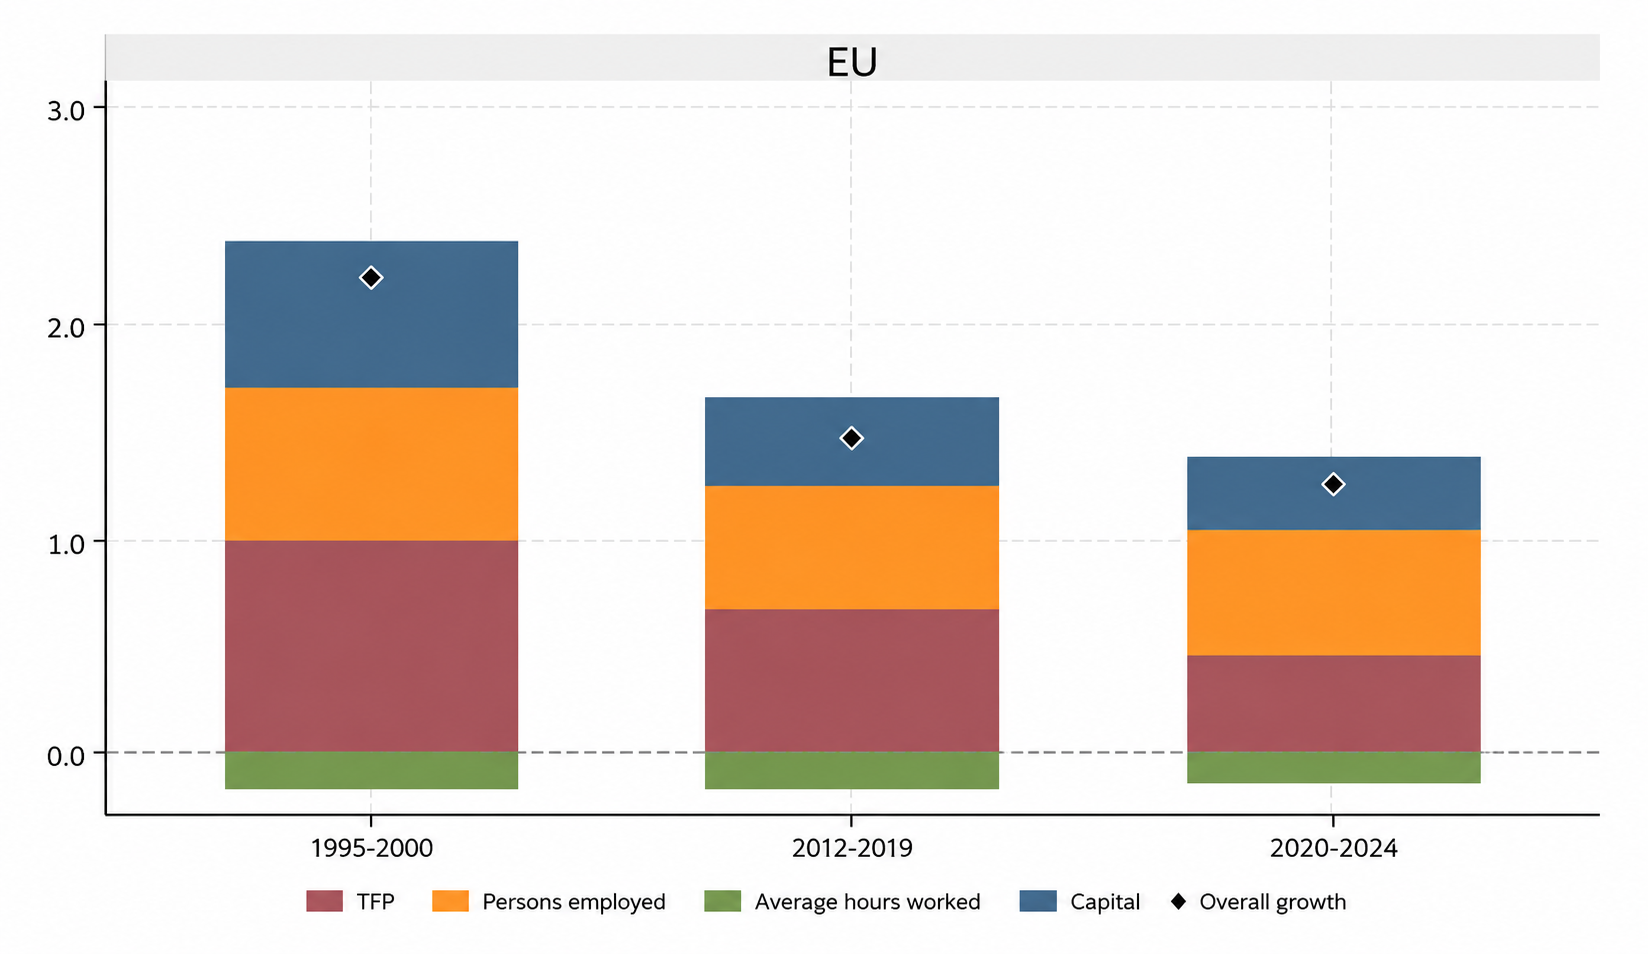
Europe’s economy has been losing speed for three decades. Between 1995 and the eve of the financial crisis in 2008, the EU[1] grew by an average of 2.2% a year. In the decade of recovery from 2012 to 2019, that figure fell to 1.5%. Since 2020 – through the pandemic, the energy shock, and the return of inflation – it has averaged just 1.2%.
The slowdown alone is perhaps not the most worrying part. What has changed is where the growth comes from. Before the financial crisis, most of Europe’s growth came from two sources: better technology, more efficient ways of working (or what economists call total factor productivity, or TFP), and investment in machinery, buildings, and software. Together, they accounted for three quarters of growth. Since 2020, TFP’s share has fallen from 45% to 36%, and capital’s share from 30% to 26.5%. The gap has been filled by labour: more people in jobs.
Figure 1 / Value added growth decomposition, in %
Source: wiiw GPD, www.euklems.eu
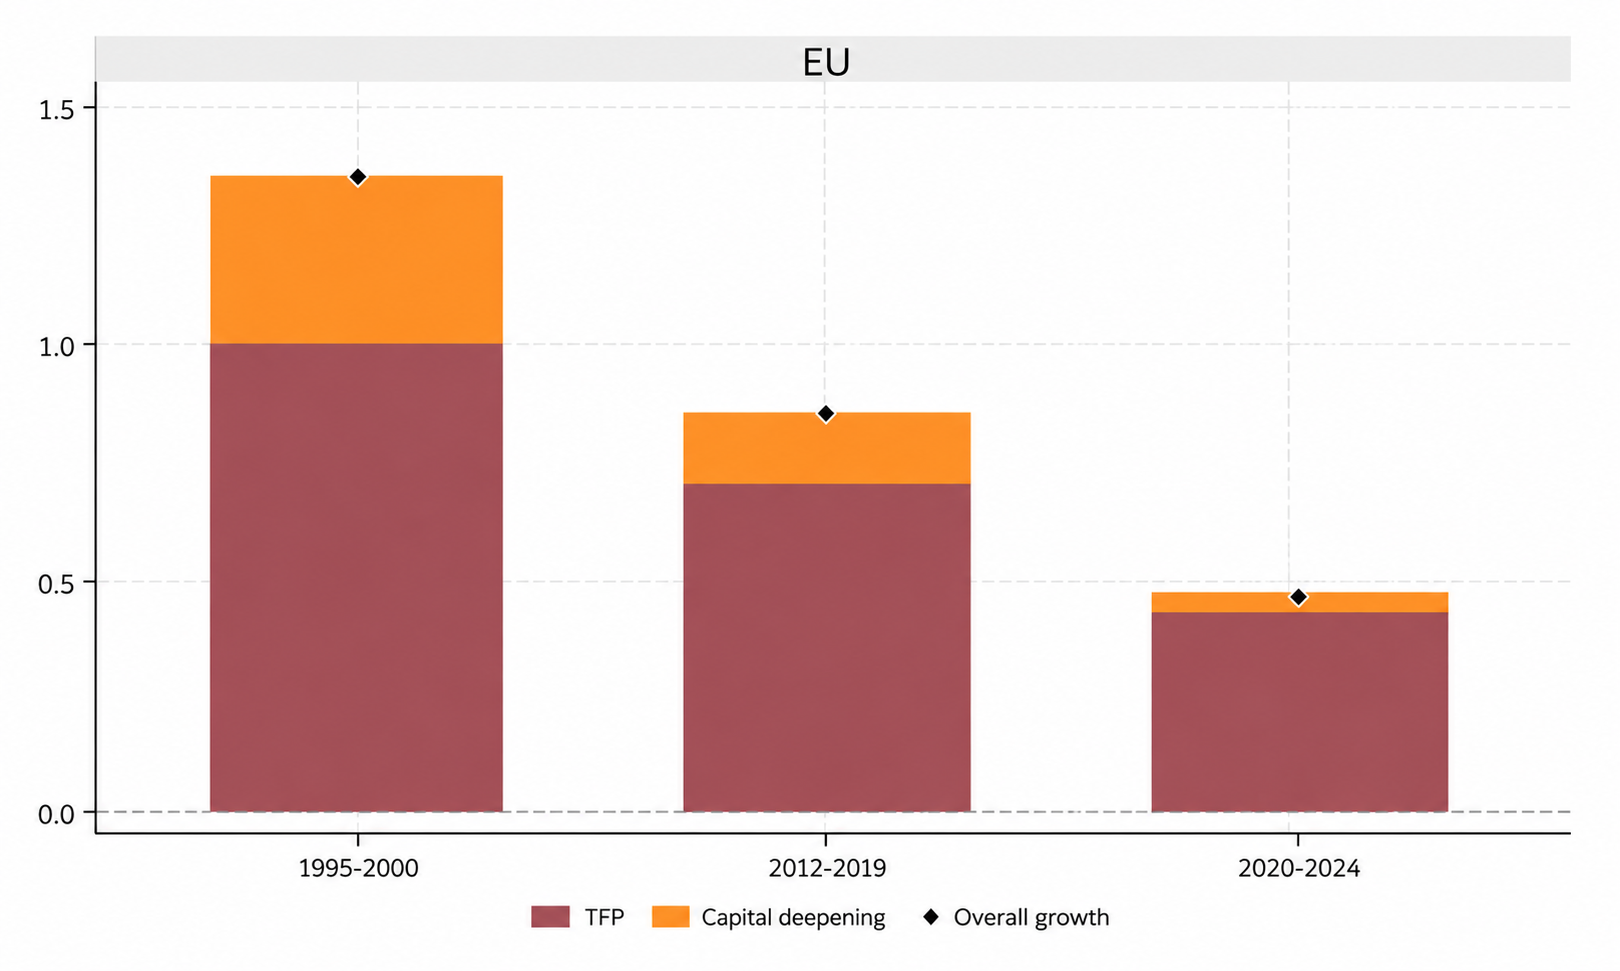
This shows up clearly in labour productivity, the amount produced per hour worked. Its growth has dropped from 1.3% a year before the crisis to 0.9% in the 2010s and just 0.5% since 2020. What little productivity growth remains comes almost entirely from efficiency gains. Investment has stopped adding to it.
Figure 2 / Labour productivity growth (per hour worked), in %
Source: wiiw GPD, www.euklems.eu
A continent running down its capital
The country data make the investment problem concrete. In 1995-2008, only three member states saw the capital available per hour worked shrink. In 2012-2019, that rose to eight. Since 2020, it has been 12, or nearly half of the EU. In these countries, the average worker now has less equipment and infrastructure to work with than before.
The big economies are stuck
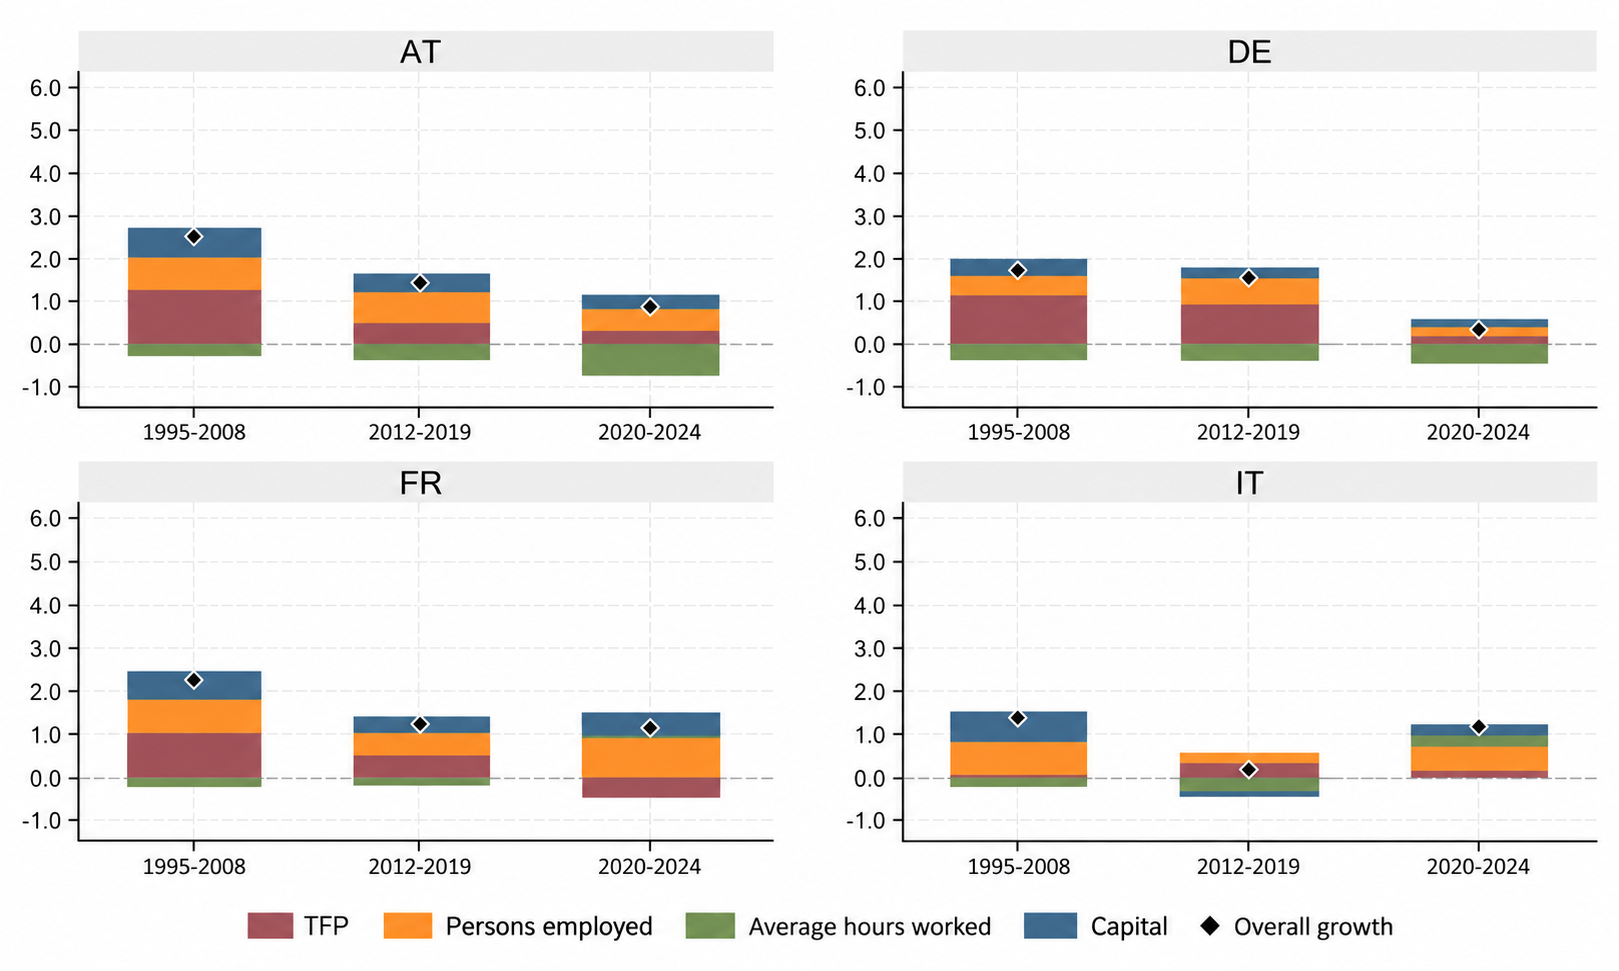
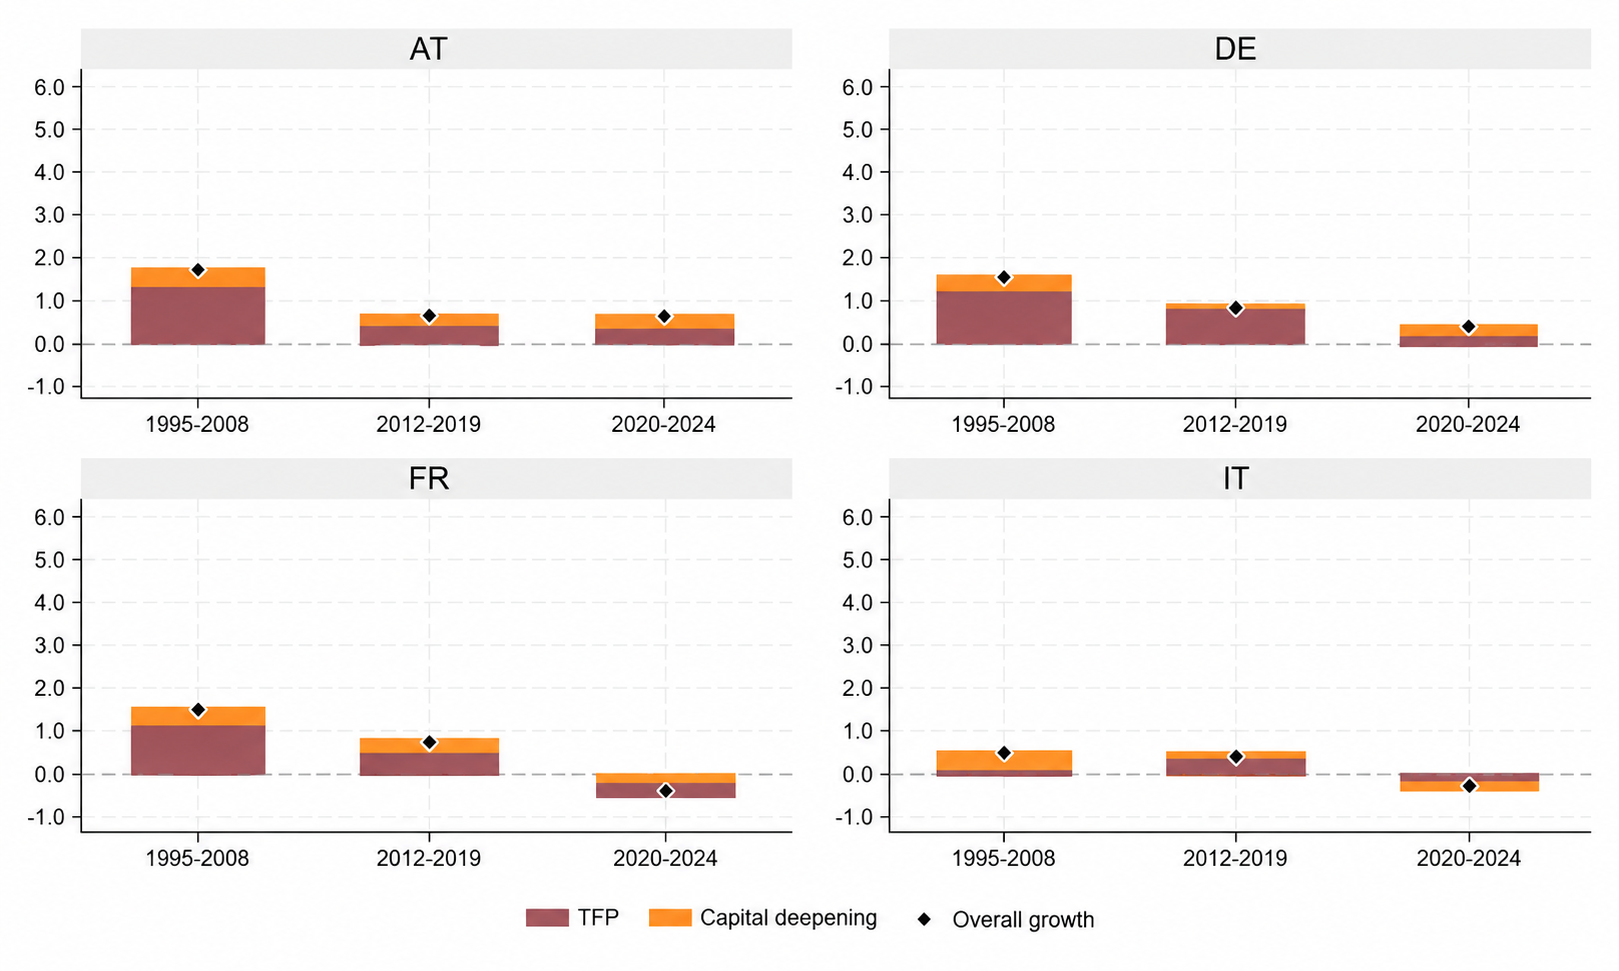
The EU’s three largest economies illustrate the problem, though in different ways. Germany, long the bloc’s growth engine, has slowed from 1.7% a year before the crisis to just 0.1% since 2020, and investment now contributes almost nothing. France still manages around 1% growth, but only because employment has risen strongly. Its output per hour has fallen since 2020, as efficiency gains have turned negative. Italy has barely raised its productivity in 30 years, and it has also slipped into decline and remained there since 2020. By contrast, Austria – with a growth rate of 0.5% for value added and 0.7% for labour productivity – fared slightly better and also managed to increase its capital per hour worked more than the big economies.
Figure 3 / Growth decompositions for Austria, Germany, France, Italy, in %
Labour productivity growth (per hour worked)
Source: wiiw GPD, www.euklems.eu
A southern recovery built on jobs
The good news comes from the South. Spain, Greece, and Portugal, the crisis cases of the early 2010s, are now growing at 1.4-1.8% a year, faster than Germany and France. Greece, which shrank through most of the 2010s, is growing again. However, the capital available per worker is falling in all three countries, and their recoveries rest largely on bringing people back to work. That is a real achievement, but it is not a lasting source of growth once unemployment has come down. Croatia has made a comeback to a growth rate of about 4% since 2020, with labour productivity growth of 2.3%, mostly driven by efficiency gains. Part of this strength reflects EU support: Croatia, Greece, Portugal, and Spain are among the largest recipients of Recovery and Resilience Facility funds relative to the size of their economies, and IMF estimates suggest that the funds added more than one percentage point to growth in Greece and Croatia in 2025 alone (see also Jaillet & Rubio, 2026). So far, however, the boost has seemingly come mainly through demand and jobs rather than a build-up of capital.
Figure 4 / Growth decompositions for Croatia, Greece, Portugal, Spain, in %
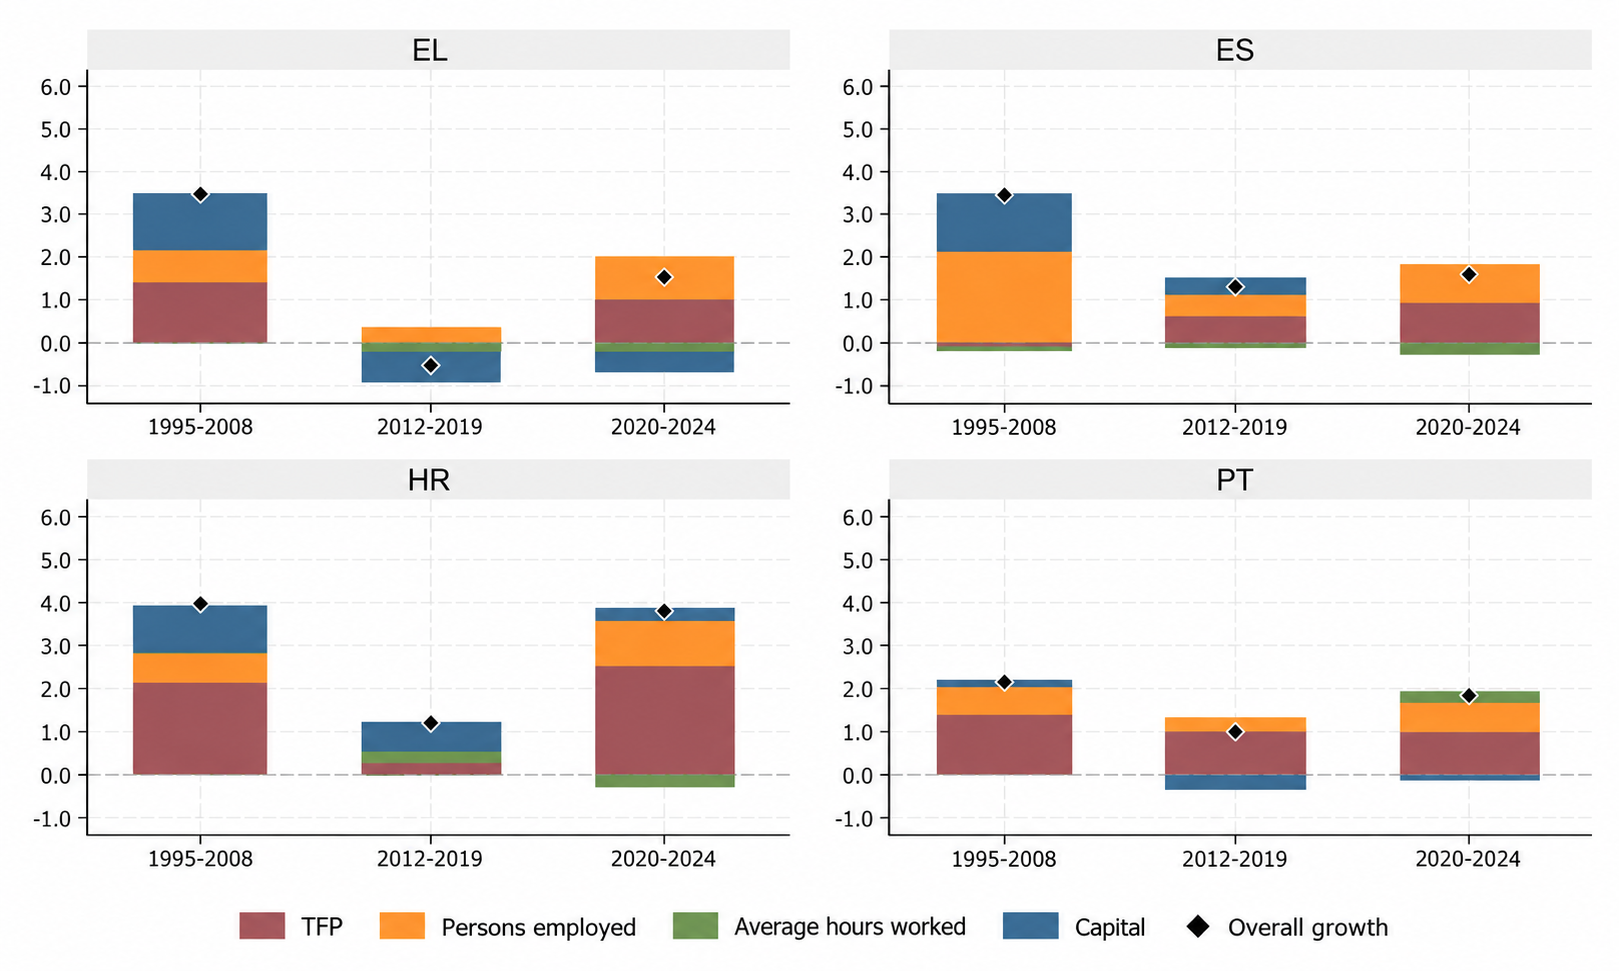
Labour-productivity growth (per hour worked)
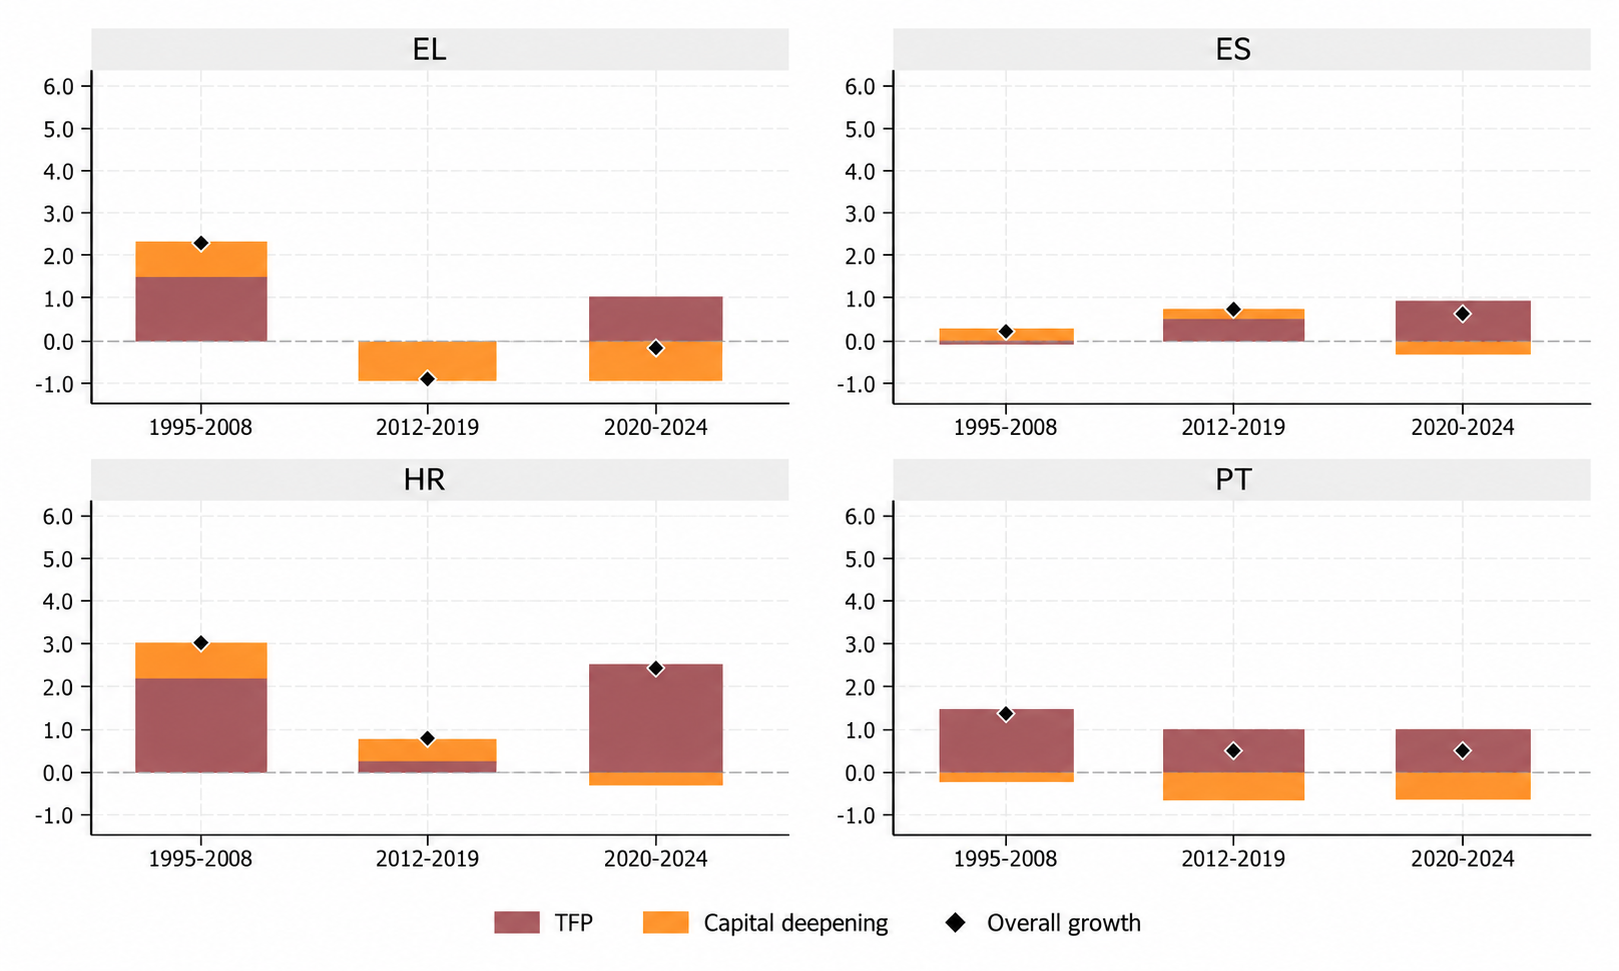
Source: wiiw GPD, www.euklems.eu
The convergence machine slows down
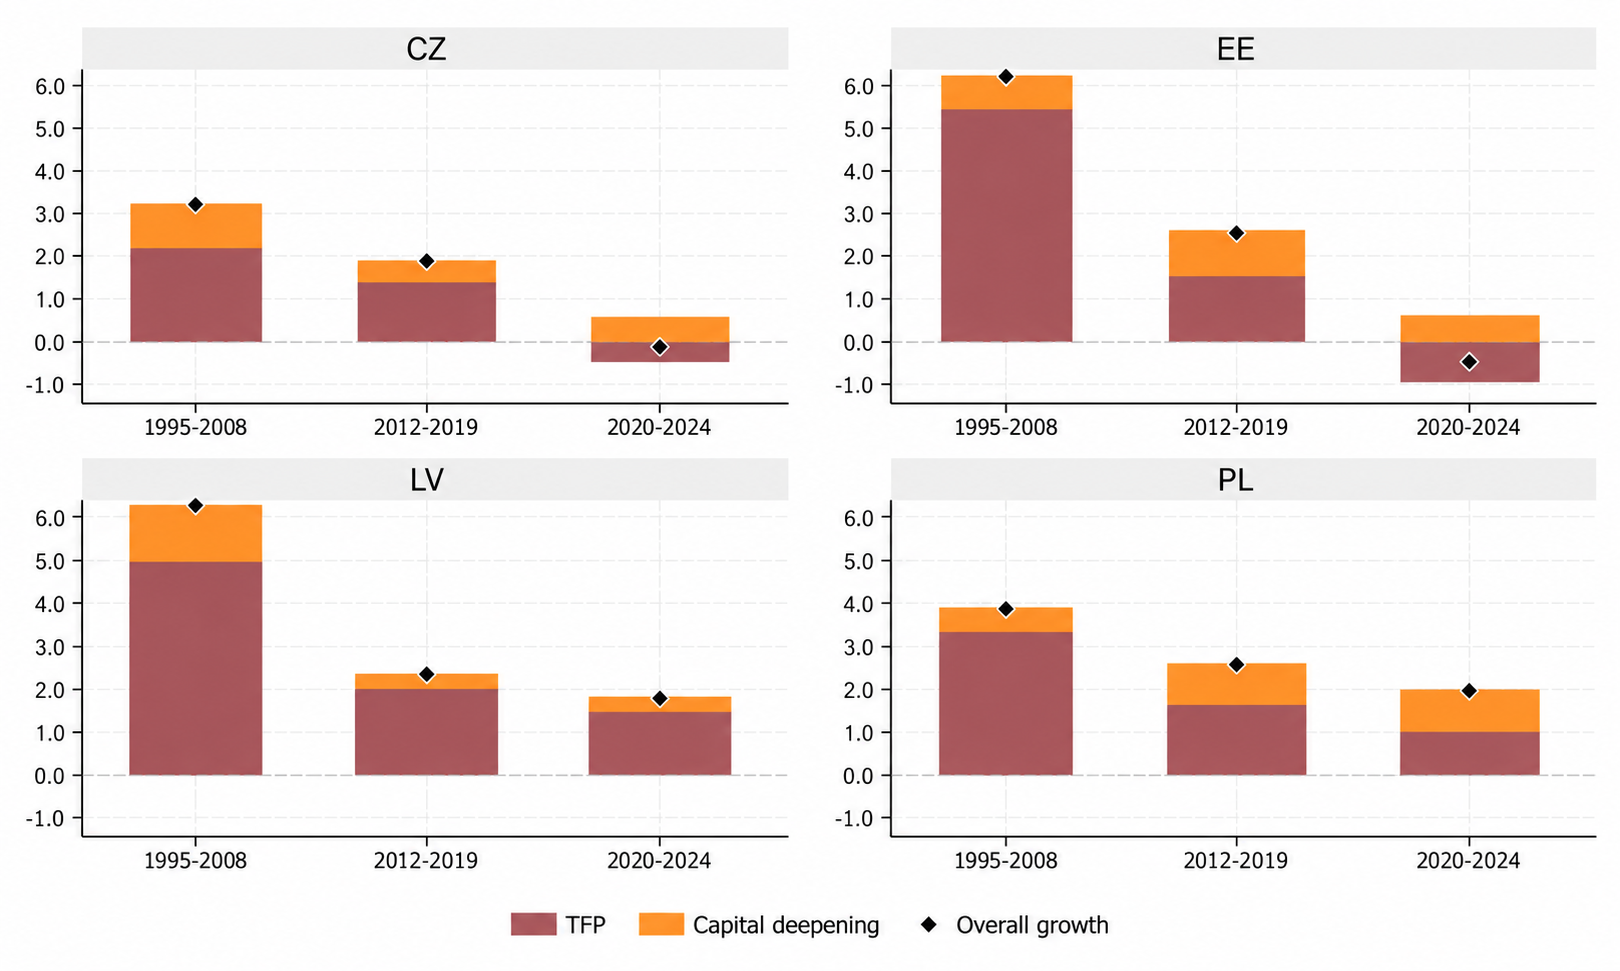
For two decades, the Baltic states and Central Europe were the EU’s growth stars, catching up quickly with the West. But that momentum has now faded. Estonia grew by 6% a year before the financial crisis and by 3.2% in the 2010s, but it has barely grown at all since 2020. Latvia fell from 6.7% to under 1%, and Czechia from 3.2% to 0.5%. In both Estonia and Czechia, efficiency gains have turned negative.
Figure 5 / Growth decompositions for Czechia, Estonia, Latvia, and Poland, in %
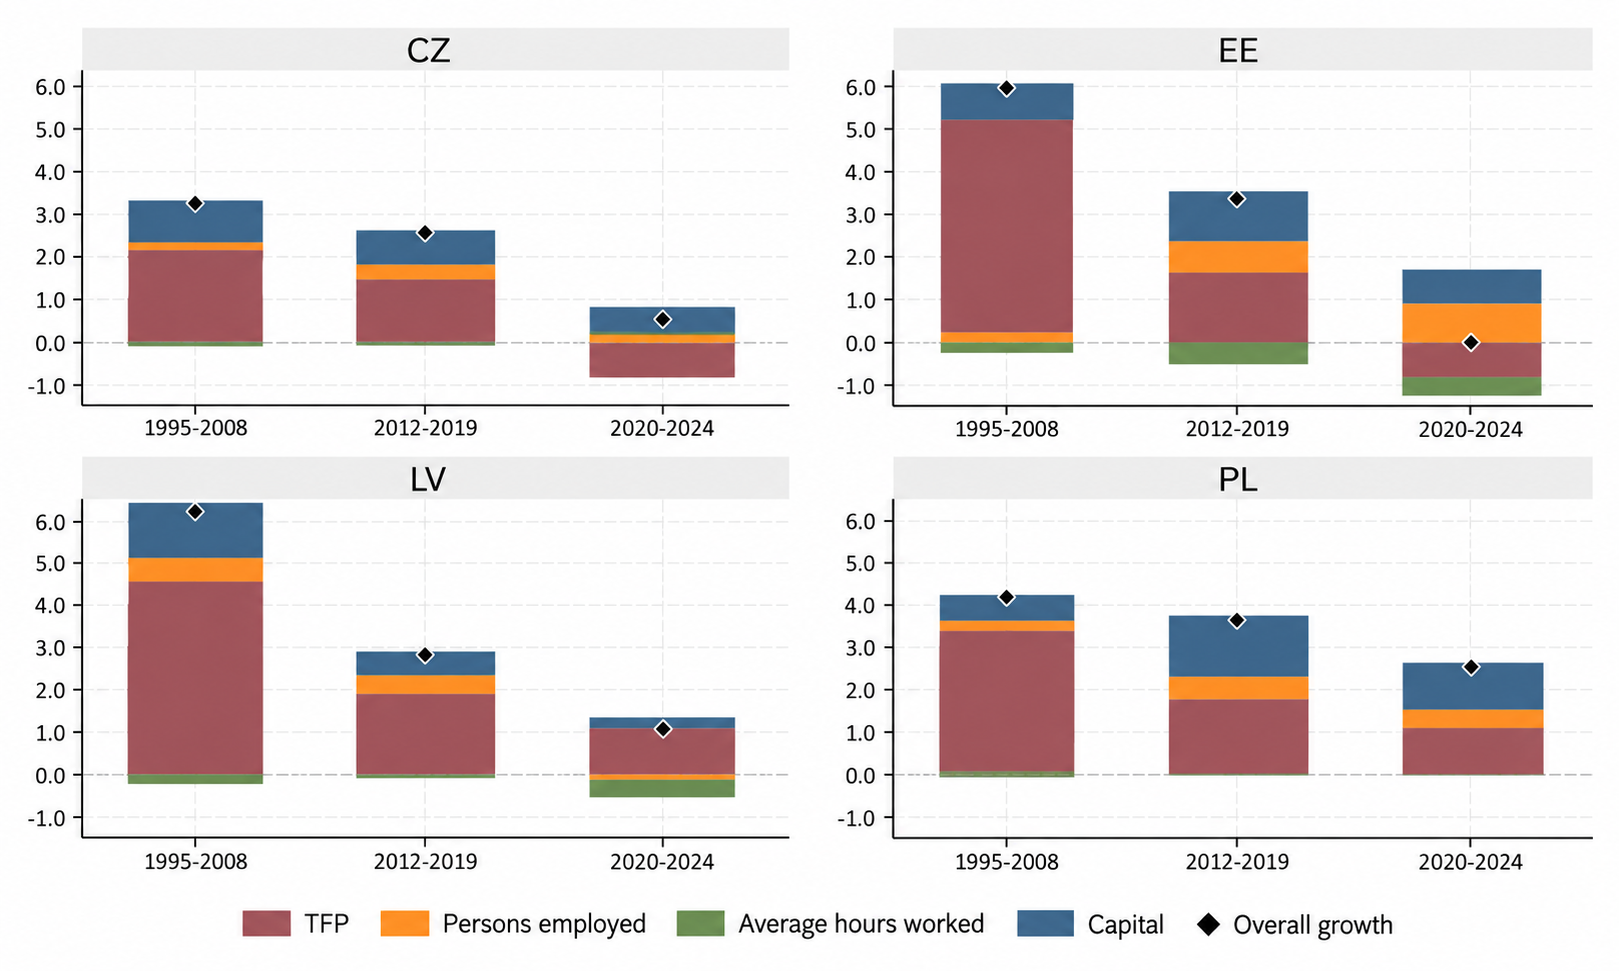
Labour-productivity growth (per hour worked)
Source: wiiw GPD, www.euklems.eu
Poland has kept growing at 2.6% a year since 2020, and it is one of the few countries where investment still lifts productivity in a meaningful way. Output per hour worked in Poland has grown by around 2% a year, four times the EU average and with a significant impact of capital deepening. Croatia (3.7%) and Bulgaria (2.8%) show even higher growth rates. However, productivity growth (2.3% in Croatia and 2.5% in Bulgaria) in these two countries has been driven by efficiency gains rather than capital deepening. Lithuania also has grown significantly in value-added terms (2.5%), but less so in terms of productivity (1.1%).
What Brussels has been told
The numbers echo the diagnosis in two influential reports commissioned by the EU. In April 2024, former Italian Prime Minister Enrico Letta argued that Europe must turn idle savings into productive investment at home, proposing a ‘Savings and Investments Union’ built on a deeper single market. Five months later, former European Central Bank President Mario Draghi put a figure on the shortfall – an extra EUR 750-800 billion of investment a year, or around 4-5% of EU GDP – which he saw as the key to reviving Europe’s productivity.
Building on both reports, the Commission made the Savings and Investments Union a central pillar of its growth strategy in March 2025. Delivery, however, has lagged. By July 2026, only 15.7% of Draghi’s 383 recommendations had been fully implemented, according to the Draghi Observatory of the European Policy Innovation Council (EPIC).
How bad that looks depends on who’s counting: Institute Montaigne, which tracks a broader list of 567 recommendations, puts implementation at around 30% and considers the EU broadly on schedule, though mostly thanks to easier Commission-led measures. Meanwhile, the financing challenge has grown as defence spending rises sharply, and the investment gap with the US is widening. The shrinking stock of capital per hour worked in nearly half of the member states tells the same story.
More workers is not a sustainable strategy
Europe’s labour-driven growth model has limits. Populations are ageing, the workforce will soon start shrinking in many member states, and average hours per worker have been falling in almost every country for decades. If growth depends on adding more people to the workforce, it will run out. The numbers point in one direction: Europe’s growth problem is an investment and productivity problem. Poland shows what the alternative looks like. For much of the rest of the EU, the challenge is to start building up capital again before the supply of new workers becomes a limiting factor.
Update of the wiiw Growth and Productivity Database
An update to the wiiw Growth and Productivity Database, including a new exploration and visualisation tool, is now available at www.euklems.eu. The data contained in the database provide information on value-added and productivity growth as well as growth contributions (e.g. capital and labour inputs) for the EU member states at the level of 21 NACE Rev. 2 1-digit industries. The basic data cover the 1995-2024 period, though coverage varies across countries and industries for some more sophisticated calculations. We essentially follow the widely used KLEMS approach (see Jorgenson et al., 1987; Jorgenson et al., 2005; Timmer et al., 2010) and provide three different datasets, depending on the availability of reliable underlying information (e.g. detailed employment and wage data for calculating ‘labour services’ and detailed information on gross fixed capital formation (GFCF) and capital stocks by asset type for calculating ‘capital services’); for details, see.
The updated wiiw Growth and Productivity Database is available here.
References
Jaillet, P. & Rubio, E. (2026). Southern Europe’s impressive post-Covid performance: What impact are European recovery funds having on the recovery momentum. Jacques Delore Institute, Policy Brief May 2026.
Jorgenson, D. W., Gollop, F. M. & Fraumeni, B. M. (1987). Productivity and US economic growth. Cambridge, MA: Harvard University Press.
Jorgenson, D. W., Ho, M. S. & Stiroh, K. J. (2005). Information technology and the American growth resurgence. Cambridge, MA: MIT Press.
Timmer, M. P., Inklaar, R., O’Mahony, M. & van Ark, B. (2010). Economic growth in Europe: A comparative industry perspective. Cambridge, UK: Cambridge University Press.
Footnotes:
[1] The EU refers to the current 27 member states throughout, including for years before they joined.