How Trump’s new tariffs will impact the EU’s already struggling automotive industry
01 April 2025
The newly announced US tariffs of 25% on automotive imports will have the greatest impact on the ‘EU’s manufacturing core’ – namely, the car industries in Germany, Austria and the Visegrád countries – as well as Mexico, Canada, South Korea and Japan. This represents yet another blow to the EU’s struggling automotive industry
image credit: istock.com/Tramino
Trade in the automotive industry in a global perspective
On 2 April 2025, the US administration under President Donald Trump will begin imposing 25% tariffs on automotive imports. While the specifics remain unclear, this move is expected to have a significant impact on global trade – and Europe’s car industry.
Products classified under HS Code 87 (vehicles other than railway or tramway rolling stock, and parts and accessories thereof[1]) account for nearly 10% of global goods trade. The most important traded categories include HS 8703 (motor cars and other motor vehicles primarily designed for passenger transport) and HS 8708 (parts and accessories for motor vehicles).
With about USD 300bn in annual exports, the EU is the largest exporter in this sector, holding almost 25% of the market (excluding intra-EU trade), followed by Mexico (12.6%), Japan (12.6%), the US (11.2%), China (10.5%), South Korea (6.6%), Canada (4.7%) and the UK (3.7%).[2]
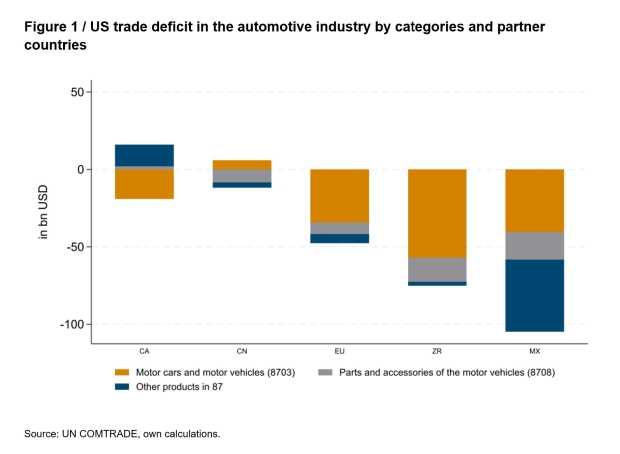
These figures show that the US actually does have a significant trade deficit of over USD 200bn in this product category. Figure 1 illustrates US trade imbalances by product category and trading partner.
Figure 1 / US trade deficit in the automotive industry by categories and partner countries
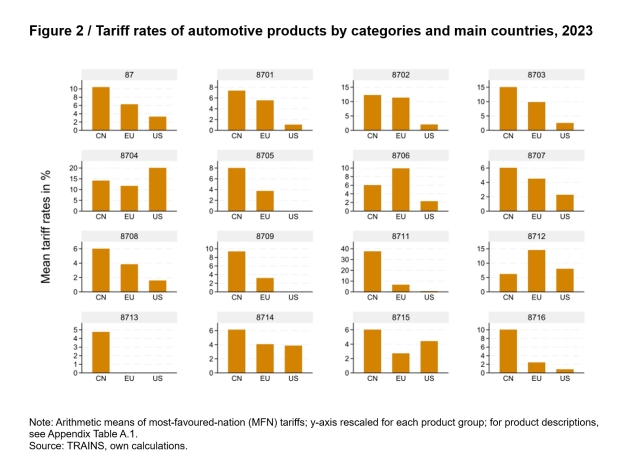
Regarding tariffs, as Donald Trump likes to claim, US import tariffs are indeed generally lower than those imposed by other countries on US exports (see Figure 2). In this product category, China applies an average tariff of 10% on US imports, while the EU imposes around 6%. In contrast, the US applies a tariff of just over 3% on imports from other countries.
For HS 8703 (motor cars and other motor vehicles), the US imposes a tariff of 2.4%, compared to 10% in the EU and 15% in China. Tariffs in HS 8708 (parts and accessories for motor vehicles) are slightly lower but follow the same ranking. The only exception is HS 8704 (motor vehicles for the transport of goods), for which US import tariffs are higher than those imposed by other countries on US exports.
Figure 2 / Tariff rates of automotive products by categories and main countries, 2023
Short- and long-term effects of higher tariffs
To assess the economic impact of a US tariff increase of 25%, as announced by President Trump, we analyse the motor vehicles, trailers and semi-trailers industry (NACE Rev. 2, Code 29). The industry’s share of total value added varies across countries, ranging from just under 4% in Mexico and slightly over 2% in South Korea and Japan to approximately 1.7% in the EU and China. In the US, this industry’s share of total GDP is 1%.[3] The largest players in the industry are the EU (25%), China (23%), the US (15%) and Japan (10%). These countries also account for the largest shares of global exports in this sector.
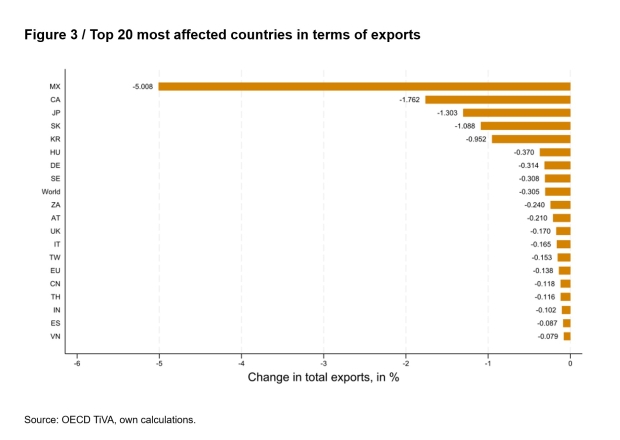
We model the short-term effects of a 25% US tariff hike by assuming a 25% decline in exports from all countries to the US, including both intermediate and final goods exports.[4] For the EU, this would imply a decline of exports of about USD 8bn. Countries with larger exports to the US would naturally be more affected. The most impacted countries are shown in Figure 3. Total exports (including goods and services) would decline by 5% in Mexico, 1.8% in Canada, 1.3% in Japan, 1.1% in Slovakia (which is the hardest-hit economy in the EU due to its large exposure to the automotive industry), and about 1% in South Korea. While exports from other countries would decline by less than 0.5%, EU exports would decrease by approximately 0.14%. Other EU countries that would be hit relatively hard are Hungary, Germany and Sweden (each with declines of 0.31% in total exports) and Austria (0.21%), reflecting these countries’ big footprint in the automotive industry.
Figure 3 / Top 20 most affected countries in terms of exports
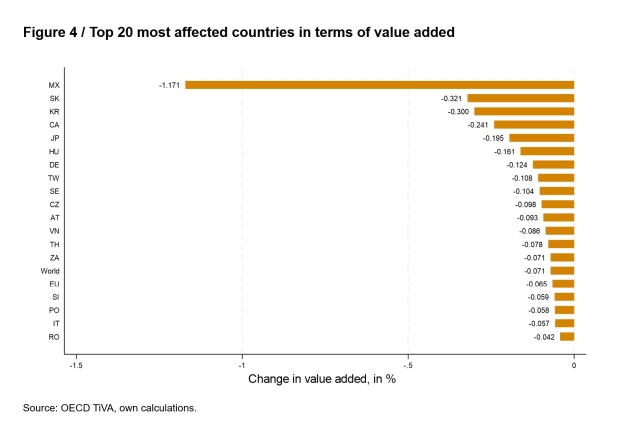
A change in the gross exports of one country impacts the income of other countries through linkages across the global value chain. By taking these value chain effects into account, we can calculate the impact of export declines across all countries, as shown in Figure 4. The hardest-hit economies are Mexico (-1.2%), Slovakia (-0.3%), South Korea (-0.3%), Canada (-0.2%) and Japan (-0.2%). The GDP of the EU would decline by 0.07% (or USD 9bn), with the most affected countries being Slovakia, Hungary, Germany, Sweden, Czechia and Austria – countries that are part of the ‘EU manufacturing core’ and heavily specialised in automotive industry value chains.
Figure 4 / Top 20 most affected countries in terms of value added
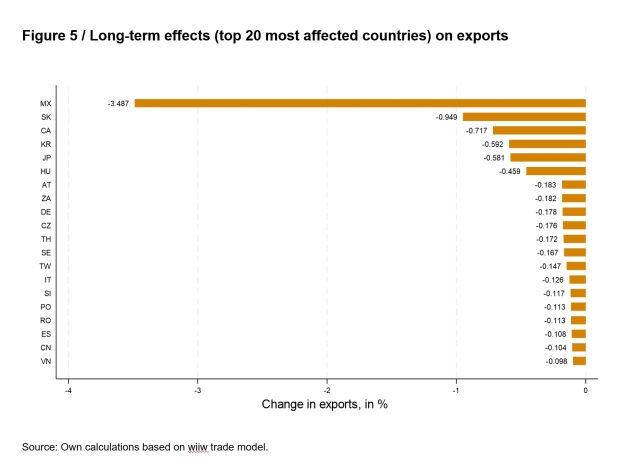
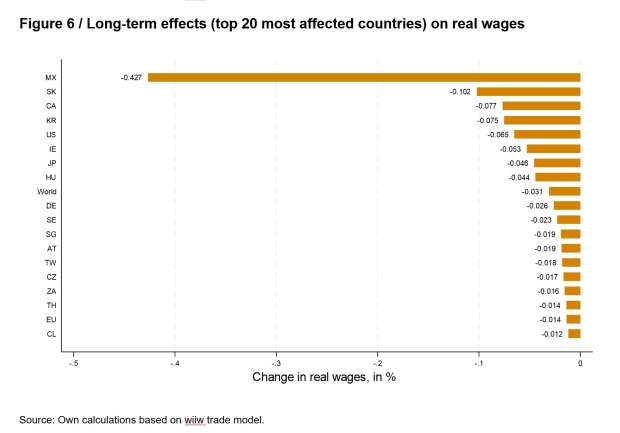
From a longer-term perspective, one can assume potential specialisation and trade redirection effects, as considered in standard trade models. The effects of the tariff hike in a typical computable general equilibrium (CGE) model framework[5] are presented in Figures 5 and 6, showing both exports and real wages, respectively. The ranking of the most affected countries is similar to the short-term effects mentioned above, but the magnitudes are smaller, as by definition it is assumed that overall employment levels are unaffected. This applies to both the decline in exports and the decline in real wages. However, as shown, in the longer term, real income in the US also declines by 0.07%, primarily driven by price increases resulting from the higher tariffs.
Figure 5 / Long-term effects (top 20 most affected countries) on exports
Figure 6 / Long-term effects (top 20 most affected countries) on real wages
Another attack against the rules-based global trading system
Although the negative consequences of such a tariff imposed by the US on automotive imports do not seem to be devastating at the overall economy level, they will hit the EU economy – particularly Germany, Austria and other countries in the ‘EU manufacturing core’ – at a difficult time. These countries are already facing expectations of low or even negative growth. In particular, the automotive industry in Europe is under significant pressure due to the rapid pace of technological change required for e-mobility as well as fierce competition from China, which is aggressively developing this technology, not least through substantial public subsidies. In this context, it is important to note that the overall figures presented here conceal the direct effects on specific firms and regions, which are likely to be hit very hard. The pressures from the green transition, Chinese competition and these recent tariff hikes will require a successful process of ‘creative destruction’ driven by innovation and technological change. Furthermore, these new tariffs – alongside those which may be announced this week (though this is far from being certain) – will exacerbate global uncertainties and represent another blow to the increasingly undermined rules-based global trading system.
Footnotes:
[1] See Appendix Table A.1 for a more detailed list of products in this category.
[2] Figures for 2023 according to UN COMTRADE import flows.
[3] Figures for 2020 based on OECD TiVA database (Release 2024).
[4] This corresponds to an assumption of a full pass-through and a demand elasticity of -1, or an incomplete pass-through with a correspondingly larger elasticity.
[5] This is based the Caliendo-Parro framework (see https://wiiw.ac.at/eu-carbon-border-tax-general-equilibrium-effects-on-income-and-emissions-p-7073.html for the specific modelling details). The framework does not include effects of disruptions or restructuring of GVCs, effects of changes in FDI, etc.

