Productivity growth stagnates at low levels in the EU – updated wiiw Growth and Productivity Database
04 December 2024
Throughout the EU, productivity growth has been declining, particularly since the global financial crisis. However, labour productivity growth has stabilised in the Western and Southern EU member states, whereas it has declined in the EU member states of Central and Eastern Europe
image credit: unsplash.com/Christopher Burns
An update to the wiiw Growth and Productivity Database is now available at www.euklems.eu.[1] The data contained within provide information on value-added and productivity growth, as well as growth contributions (e.g. capital and labour inputs) for the EU member states at the level of 21 NACE Rev. 2 1-digit industries. The basic data cover the period 1995-2023, though for some more sophisticated calculations, coverage varies across countries and industries. We essentially follow the widely used KLEMS approach[2] (see Jorgenson et al., 1987; Jorgenson et al., 2005; Timmer et al., 2010) and provide three different datasets, depending on the availability of reliable underlying information (such as detailed employment and wage data for calculating ‘labour services’ and detailed information on gross fixed capital formation and capital stocks by asset type for calculating ‘capital services’; for further details on the varying coverage, see Stehrer, 2024).
These data allow for a wide range of detailed analysis across countries, industries and time. Here we highlight some selected important findings, showing simple averages for specific time periods. We compare the trends before the global financial crisis (GFC) (1996-2007), during the crisis (2008-2010), after the crisis (2011-2019) and through the years of the COVID-19 pandemic and its aftermath (2020-2023).[3] We also compare country groups, focusing on EU-CEE11 (Bulgaria, Croatia, Czechia, Estonia, Hungary, Latvia, Lithuania, Poland, Romania, Slovakia and Slovenia), the EU Southern economies (Greece, Italy, Portugal and Spain – referred to collectively as EU-South) and the remainder (excluding Ireland, for data reasons), referred to as EU-West.
Drivers of value-added growth
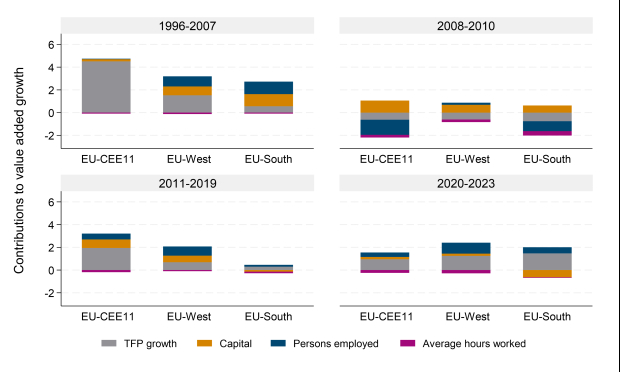
Figure 1 shows the contributions to value-added growth. We distinguish the contributions made by the growth of capital and of persons employed, changes in average hours worked, and total factor productivity (TFP) growth as the residual. First, one can observe a slowdown in growth in all countries following the global financial crisis; since 2020, there has been a slightly better performance by the EU-West and EU-South country groups, pointing towards the phenomenon of ‘secular stagnation’ – a phrase coined by Larry Summers (see, for example, Summers, 2014).[4] This slowdown has largely been driven by a decline in TFP growth. The contribution of capital growth to value-added growth has also declined generally and has been particularly low since 2020, even turning negative for EU-South.[5] For the 11 EU-CEE economies, there has been a marked decline in TFP growth, which since 2020 has fallen below the level of EU-West and EU-South.[6] Finally, the contribution of the growth in persons employed has been positive (except during the years of the global financial crisis), whereas the contribution of the growth in average hours worked has been slightly negative across all country groups and periods considered, indicating that hours worked per person have declined on average.
Figure 1
Contributions to value-added growth at the level of the total economy, in %
Source: wiiw Growth and Productivity Database, own calculations.
Trends in labour productivity growth
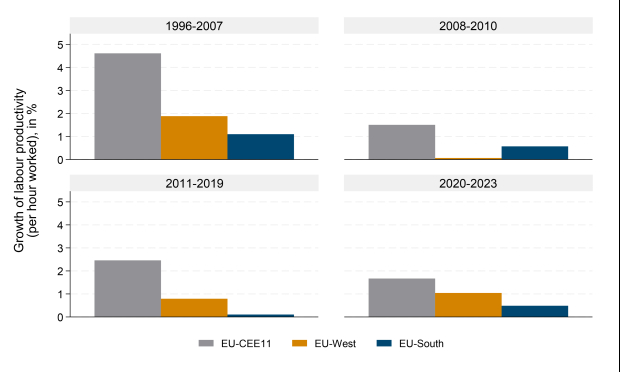
Real income growth (or growth of GDP per capita) is essentially driven by labour productivity growth. The performance of these country groups with respect to this latter indicator is shown in Figure 2 for the total economy. Once again, a significant slowdown in productivity growth is evident over the years, particularly compared to the period prior to the global financial crisis. However, labour productivity growth (per hour worked) has stabilised (or has even increased slightly) in the EU-West and EU-South countries, while it has declined in the 11 EU-CEE countries over this period. For EU-CEE11, there has been a continuous slowdown in productivity growth. It is worth noting that the difference in growth rates compared to EU-West has narrowed steadily, indicating that although those countries still perform better, the ‘advantage of backwardness’ (Gerschenkron, 1962) is losing relevance.
Figure 2
Growth in average labour productivity per hour worked, by country group and time period, for the total economy, in %
Source: wiiw Growth and Productivity Database, own calculations.
Labour productivity growth is driven by growth in total factor productivity
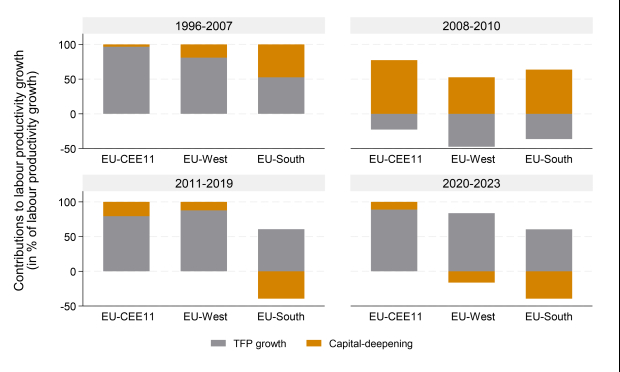
Figure 3 highlights the fact that labour productivity growth is primarily driven by TFP growth, whereas capital-deepening (i.e. the growth of the capital-to-labour ratio in terms of hours worked) generally plays a minor role. Capital-deepening has become slightly more important for the EU-CEE11 economies, whereas its role for the EU-West and EU-South economies has declined, particularly in the most recent years; this could indicate a lack of investment.
Figure 3
Contributions to labour productivity growth, in %
Source: wiiw Growth and Productivity Database, own calculations.
Uneven sectoral developments
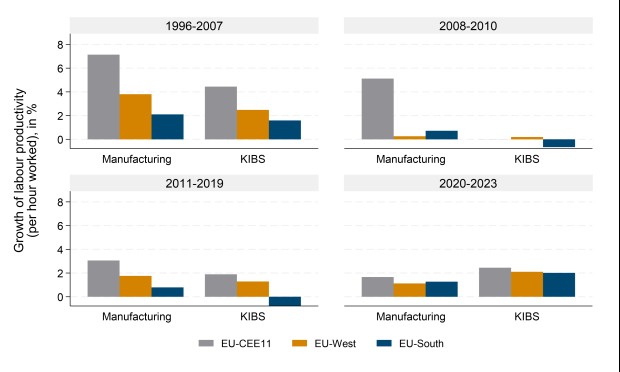
Underlying this overall performance are differentiated developments at the industry level. Figure 4 shows labour productivity growth for selected industries, comparing manufacturing (NACE Rev. 2 C) and three broadly knowledge-intensive business services (KIBS) taken together: the information and communication industry (NACE Rev. 2 J), financial and insurance services (NACE Rev. 2 K) and professional, scientific and technical activities (NACE Rev. 2 M).[7] Focusing on the performance of EU-CEE11, one can see that the slowdown in productivity growth relative to EU-West is particularly pronounced in the manufacturing industry, which, following the transition, used to be one of the driving forces behind the performance of these countries, but which now – as indicated above – seems to be losing momentum. It is a similar story (albeit less pronounced) with the KIBS industries, where the growth differential has always been slightly smaller than for manufacturing. Notably, since 2020 average labour productivity growth in EU-South has also picked up, relative to EU-West.
Figure 4
Growth in average labour productivity per hour worked, by country group and time period, for selected industries, in %
Note: KIBS include the Information and communication industry (J); Financial and insurance activities (K) and Professional, scientific and technical activities (M).
Source: wiiw Growth and Productivity Database, own calculations.
The role of capital assets
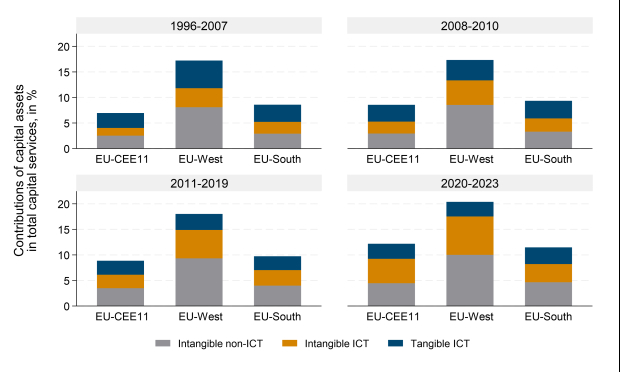
There is also an important difference in the use of ICT and intangible capital. Figure 5 shows the shares of three combined asset types.[8] The three asset types presented are intangible non-ICT (research and development and other intellectual property products), intangible ICT (computer software and databases) and tangible ICT (computer hardware and telecommunications equipment). These assets have comprised about 20% of the contribution made to capital services growth in EU-West in recent years, up from about 17% in the late 1990s. EU-CEE11 and EU-South clearly lag behind in the use of such assets, particularly in intangible non-ICT and intangible ICT, though the share of tangible ICT is more similar. Although the shares of these asset types have also been rising in these countries, the gap that exists with EU-West has hardly changed. This indicates a strong need for R&D investment and investment in computer software and databases in these countries.
Figure 5
Contributions of asset types to capital services growth, in %
Source: wiiw Growth and Productivity Database, own calculations.
Summary and outlook
‘Productivity isn’t everything but in the long run it is almost everything. A country’s ability to improve its standard of living over time depends almost entirely on its ability to raise its output per worker.’ Thus wrote economist Paul Krugman in 1990. The updated wiiw Growth and Productivity Database allows for the study of trends and underlying factors of productivity and growth in detail at the country and industry level. This database will be updated from time to time. Unfortunately, data gaps still hamper a more complete and detailed analysis of growth and productivity trends across countries and industries. Some data gaps will hopefully be filled in the forthcoming National Accounts benchmark revisions.[9]
wiiw Growth and Productivity Database
Footnotes:
[1] The financial support for the update received from the Austrian National Bank (OeNB) is gratefully acknowledged.
[2] EU KLEMS is an industry-level, growth and productivity research project. EU KLEMS stands for EU level analysis of capital (K), labour (L), energy (E), materials (M) and service (S) inputs.
[3] Note that for the latter period, the figures presented must be interpreted with caution, since for some countries detailed data on growth accounts are lacking for the recent years.
[4] Originally this idea was formulated in Hansen (1939).
[5] The greater contribution of capital growth during the GFC is, to some extent, an artefact of the method, as the data do not allow capital utilisation rates to be taken into account.
[6] One needs to bear in mind, however, that data coverage differs for the later years; thus this result must be treated with some caution.
[7] Figure 4 shows the simple mean over these industries, by country group and time period.
[8] The share of tangible non-ICT capital (dwellings and other buildings and structures, other machinery and equipment and weapons systems, transport equipment, and cultivated biological resources) is not presented and is the remaining part. In recent years it has accounted for about 90% in EU-CEE11 and EU-South, but for only about 80% in EU-West.
[9] For details and recent developments, see https://ec.europa.eu/eurostat/statistics-explained/index.php?title=National_accounts_coordinated_2024_benchmark_revision_-_impact_on_annual_main_GDP_and_employment_aggregates.
References:
Gerschenkron, A. (1962). Economic backwardness in historical perspective: A book of essays. Belknap Press of Harvard University Press, Cambridge, MA.
Hansen, A.H. (1939). Economic progress and declining population growth. American Economic Review, 29(1), 1–15.
Jorgenson, D.W., Gollop, F.M. & Fraumeni, B.M. (1987). Productivity and US economic growth. Harvard University Press, Cambridge, MA.
Jorgenson, D.W., Ho, M.S. & Stiroh, K.J. (2005). Information technology and the American growth resurgence. MIT Press, Cambridge, MA.
Krugman, P. (1990). The age of diminished expectations: US economic policy in the 1990s. MIT Press, Cambridge, MA.
Summers, L.H. (2014). US economic prospects: Secular stagnation, hysteresis, and the zero lower bound. Business Economics, 49(2), 65–73.
Timmer, M.P., Inklaar, R., O’Mahony, M. & van Ark, B. (2010). Economic growth in Europe: A comparative industry perspective. Cambridge University Press, Cambridge.

