Publications: contains »industry« (196 publications found)
The Importance of Labour Mobility for Spillovers across Industries
Neil Foster-McGregor and Johannes Pöschl
wiiw Working Paper No. 58, October 2009
33 pages including 8 Tables
Monthly Report No. 8-9/2009
Vasily Astrov, Doris Hanzl-Weiss, Zdenek Lukas and Leon Podkaminer
wiiw Monthly Report No. 8-9, September 2009
32 pages including 18 Tables and 6 Figures
Skills and Industrial Competitiveness
Michael Landesmann, Sebastian Leitner, Robert Stehrer and Terry Ward
wiiw Research Report No. 356, August 2009
99 pages including 39 Tables and 18 Figures
Monthly Report No. 5/2009
A. K. Koźmiński, Joanna Poznanska and Sandor Richter
wiiw Monthly Report No. 5, May 2009
26 pages including 11 Tables
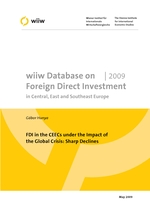
FDI in the CEECs under the Impact of the Global Crisis: Sharp Declines
Gabor Hunya and Monika Schwarzhappel
wiiw FDI Report No. 2009-05, May 2009
106 pages including 84 Tables
wiiw Database on Foreign Direct Investment 2009
wiiw Database on Foreign Direct Investment No. 2009-05, May 2009
Changes in the Structure of Employment in the EU and Their Implications for Job Quality
Enrique F. Macias, Robert Stehrer and Terry Ward
wiiw Research Report No. 354, May 2009
106 pages including 29 Tables and 48 Figures
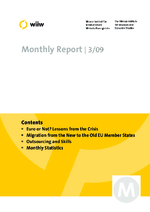
Monthly Report No. 3/2009
Michael Landesmann, Robert Stehrer and Hermine Vidovic
wiiw Monthly Report No. 3, March 2009
32 pages including 10 Tables and 9 Figures
South-North Integration, Outsourcing and Skills
Michael Landesmann and Robert Stehrer
wiiw Research Report No. 353, February 2009
34 pages including 11 Tables and 6 Figures

