What is behind the US trade deficit?

19 March 2025
President Trump uses the US trade deficit as a key argument to justify raising tariffs. The debate surrounding its causes is essential for understanding the broader elements of his agenda. Ultimately, Trump’s aim could be to restructure the global trade and financial systems
image credit: unsplash.com/Natilyn Hicks
The US trade deficit in historical perspective
The current US account deficit is a central argument used by the US administration to claim that the country is ‘treated unfairly’. Since the early 1990s, the US has maintained a strong net borrowing position, which now amounts to approximately 3% of GDP (see Figure 1). This is largely driven by a goods trade deficit of 4% of GDP, while the services trade balance remains positive at around 1% of GDP.
Figure 1 / US trade deficits and net lending position, in % of GDP
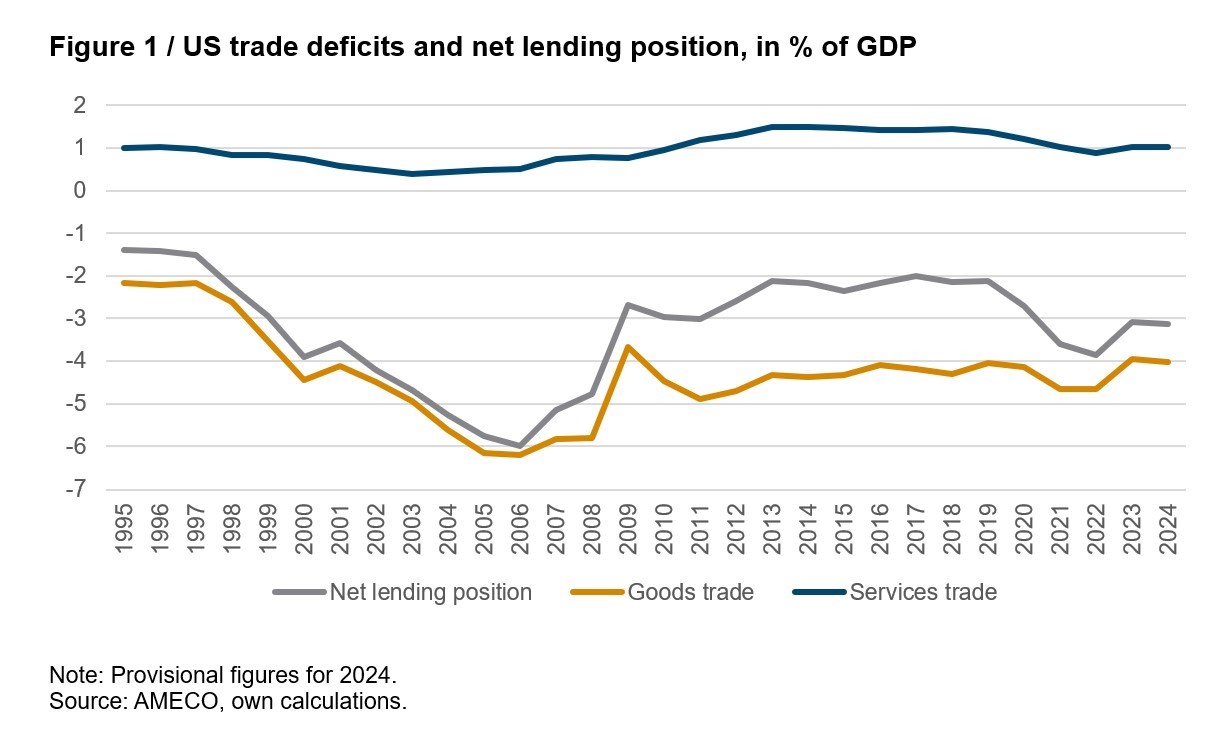
The deterioration of the goods trade balance began in the 1970s, and it had shifted from a balanced position to a deficit of approximately 2% of GDP by the early 1990s. Starting in around 1995, the deficit worsened sharply, reaching about 6% of GDP before the global financial crisis of 2008/2009. Following the crisis, it stabilised at around 4% of GDP (Figure 1). This represents a significant long-term shift.
According to Reinbold and Wen (2019), the United States maintained a goods trade surplus averaging slightly above 1% of GDP for roughly a century, from the 1870s to the 1970s. In contrast, between 1800 and 1870, the goods trade was in deficit by around 2% of GDP. Reinbold and Wen (2019) attribute these fluctuations to different phases of industrialisation. Labour-intensive mass production shifted to capital-intensive mass production during the Second Industrial Revolution (late 19th to early 20th century), followed by a shift towards mass consumption in an economy shaped by a strong financial sector and the welfare state.
This aligns with the view that the US trade deficit has worsened since the 1990s due to a loss of competitiveness in production and manufacturing industries, coupled with a shift towards specialisation in knowledge-intensive business services. Additionally, the rise of China as a strong competitor in global manufacturing has played a significant role. These factors are closely tied to the increasing importance of global value chains and the specialisation within them. As suggested by the ‘smile curve’, countries like the US tend to specialise in pre- and post-manufacturing services, while other countries focus on production and assembly (i.e. manufacturing). Indeed, as shown in Figure 2, the US runs services trade surpluses with most countries, with the exception being the UK. Nevertheless, the US continues to run overall account deficits with most countries, largely driven by the goods trade. According to recent goods trade data, the US has a positive goods trade balance with 116 out of the 230 countries listed in the data. The most important of them are the Netherlands, Hong Kong, Singapore, Australia, the United Arab Emirates, the UK and Brazil.
Figure 2 / US bilateral trade deficits by broad industry groups, in bn EUR, 2022
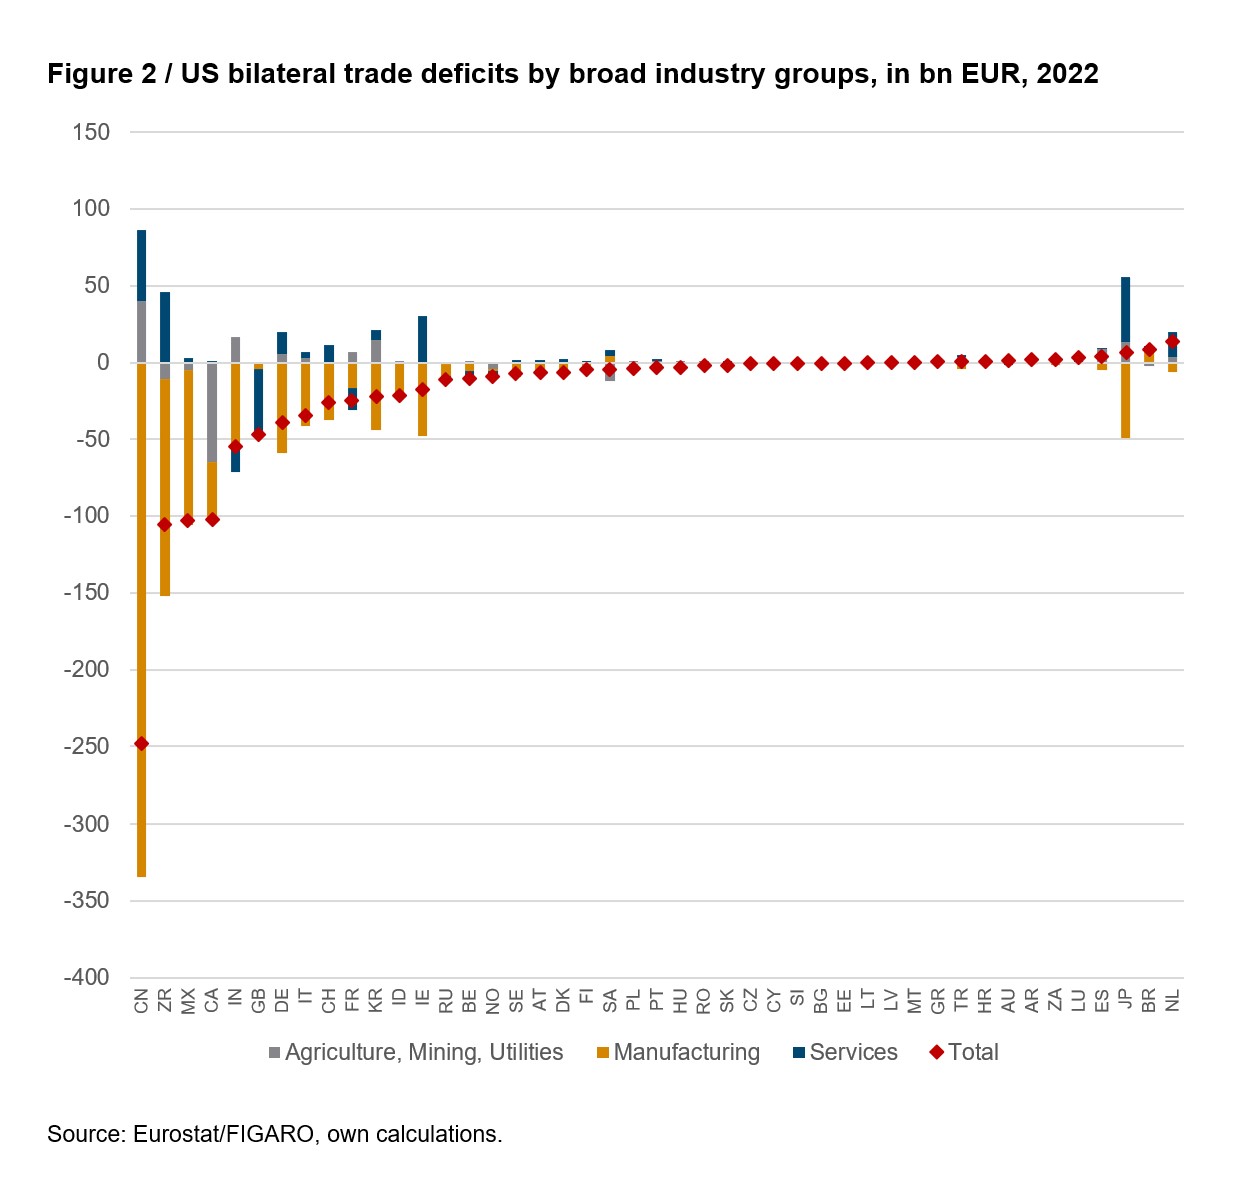
Note: ZR stands for "rest of the world".
A current account deficit constitutes a capital account surplus
According to national accounts, the flip side of the coin of a trade deficit is the corresponding capital account surplus, and net exports are equal to the difference between private savings and investment, on the one hand, and the budget deficit (or surplus), on the other. As mentioned above, the US trade balance was positive from the 1870s to the 1970s, a period characterised by high tariffs and the postwar international monetary system established during a conference in Bretton Woods, New Hampshire, in July 1944. The primary goal of the so-called Bretton Woods system was to create a stable global economic environment to prevent the financial chaos and competitive devaluations that had contributed to the Great Depression and the Second World War. It was characterised by fixed exchange rates, with the US dollar serving as the global reserve currency and being pegged to US gold reserves (i.e. the ‘gold standard’). This system began to break down in the late 1960s and early 1970s due to inflationary pressures and huge budget deficits in the US, primarily as a result of its costly war in Vietnam. The deterioration of the US trade balance began when the Bretton Woods system collapsed in the early 1970s and tariffs were significantly reduced worldwide.
There are indeed various ways to explain the US trade deficit, such as by focusing on domestic factors and global shifts (Mann 1999; Reinbold and Wen 2018; Gagnon 2017; Gourinchas et al. 2024) or by blaming other countries’ industrial, trade and exchange rate policies (e.g. Pettis 2024). A third argument posits that because the US dollar serves as the global reserve currency, demand for US dollars remains high. This implies that the US can borrow at low costs, run larger government deficits (see Draghi 2024) – which currently stand at 6.5% of GDP[1] – and, consequently, afford large external deficits. This goes hand in hand with high consumption rates, positioning the US as the ‘consumer of last resort’. As a result, since the US dollar is the global reserve currency and the global economy is growing strongly, more and more countries invest in dollar-based assets (thus holding dollar reserves), which leads to the overvaluation of the US dollar. This overvaluation, in turn, reduces the competitiveness of the US manufacturing sector, resulting in a declining share of global manufacturing and an increasing trade deficit.[2]
On thin ice
The latter two arguments, in particular, are at the core of a recent essay by Stephen Miran (2024), who has chaired the Council of Economic Advisers to the US president since March 2025. These arguments are now being debated as part of a hidden agenda (of a supposed Mar-a-Lago Accord) that aims to alter global trade and savings imbalances. The chaotic tariff policy of Donald Trump – together with other confusing or even contradictory announcements – would only be a first step in efforts to force countries (and potentially US allies) to devalue the US dollar (e.g. by selling their dollar holdings) and thereby bolster US competitiveness and exports. However, this prediction has been criticized by many economists – including Paul Krugman, Noah Smith and Tyler Cowen – for various reasons.[3] Other means of achieving this set of policy goals include imposing taxes on capital inflows and threatening to withdraw the defence umbrella, as argued in Miran’s essay.
The eventual outcomes of the expected economic distortions are already becoming evident in the US and globally, and the recently published OECD forecasts already point to a decline in global growth prospects, a weakening of business and consumer sentiment, and a sharp rise in policy uncertainty. These significant risks are expected to persist, and it is highly likely that this situation will continue for the next few years.
Footnotes:
[1] https://bipartisanpolicy.org/report/deficit-tracker
[2] This phenomenon is comparable to the Triffin dilemma already discussed in the 1960s, which led to the introduction of the IMF Special Drawing Rights in 1969. Similarly, on September 1985, the Plaza Agreement was concluded at the Plaza Hotel in New York. In this agreement, the then-G5 countries (France, West Germany, Japan, the US and the UK) agreed to bring about a devaluation of the US dollar against the yen and the German mark by exerting controlled influence on the international currency markets.
[3]For a response to these arguments by Michael Pettis, see www.ft.com/content/a0d067ab-ab94-4c2f-bda3-bbac191fe652.