Just released: wiiw Handbook of Statistics 2020
16 December 2020
The handbook includes updated macroeconomic and structural indicators on 23 CESEE economies
The wiiw Handbook of Statistics has served as a reference tool for researchers, analysts and policy makers interested in Central, East and Southeast Europe (CESEE) for many years. Its 26th edition in 2020 offers an updated set of indicators on a broad range of topics, including population and labour markets, economic growth, wages, prices, public finance and external economic relations.
The tables and maps in the first chapter allow a comparison of the main macroeconomic indicators for 23 countries in CESEE with other EU members, the UK, US and Japan. Country tables in the second chapter bring each of the 23 economies into the spotlight. The following chapters track structural changes in the region, providing a much more extensive overview of peripheral CESEE economies than comparable databases. Data on value added, employment and wages allow for an analysis of domestic performance in a breakdown by economic activities. Export flows by product and partner country, FDI inward stocks by investing countries, and economic activities offer an overview of external sector dynamics.
wiiw published data for the period 1990-2019, covering three decades of transition and convergence in the region. These data are available in the Excel version of the book.
Sample tables and maps for each chapter can be viewed for free here: PDF or Excel.
Selected trends in CESEE economies captured by data presented in wiiw Handbook of Statistics 2020
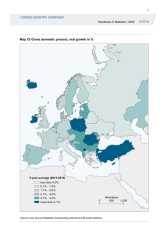
All CESEE countries posted positive real GDP growth in 2019 for a third consecutive year. However, a deceleration of economic activity became more pronounced for most of them, as only seven countries in the region grew more strongly in 2019 than in 2018. Turkey posted the most significant slowdown relative to 2018 (2 percentage points), owing to a recession in the first half of 2019.
In 2019, the strongest growth in the region was observed in Estonia, Kosovo, Hungary, Poland and Montenegro, with real GDP growth rates above 4.5%. Over the last five years, Romania, Poland, Kosovo, and Turkey grew by over 4% on average.
Detailed statistics on GDP real growth rates see:
Chapter I Cross-country overview, Table I/2 / Gross domestic product, real growth
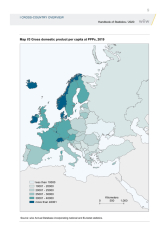
The convergence process continued in most CESEE economies in 2019. Except Turkey, Russia, Belarus, Albania and Latvia, all other economies moved closer to the average of EU27 GDP per capita at PPP last year. The highest speed of convergence was observed in Romania which gained 3.5 percentage points relative to the average EU income level.
Large disparities persist inside the CESEE region, with per capita income ranging from 93.1% of the EU average in the Czech Republic to 25.6% in Kosovo in 2019. The Czech Republic is now richer than four non-EU-CEE countries: Greece, Portugal, Cyprus and Spain.
More detailed statistics:
Chapter I, Table I/6 / Gross domestic product per capita at PPPs relative to EU-27
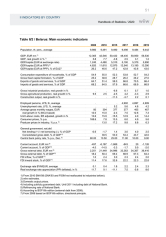
The economy of Belarus - a CESEE country which has been in focus recently due to the ongoing political crisis – already showed signs of weaknesses in 2019. Annual growth rates of GDP (1.2%), industrial production (1%) and construction (0.1%) were significantly lower in 2019 compared to 2018, partly because of the sluggish performance of the large unreformed state-owned sector amid declining subsidies. An additional important negative factor was the weak growth in Russia in 2019. Russia is the main trading partner and foreign investor of Belarus, with export and import shares of 41.5% and 55.8%, respectively. Russia accounted for 28% of Belarus’ total inward FDI stock in 2019.
More detailed statistics: Chapter II Table II/2 / Belarus: Main economic indicator
Chapter III. Structural indicators - 6. Foreign trade by partners
Chapter III. Structural indicators - 8. FDI inward stock
The large dependence of four CESEE economies on tourism made them particularly exposed to the mobility restrictions introduced in response to the COVID-19 pandemic in 2020.
Exports of travel services, defined as tourist revenue inflows according to balance of payments (BOP) methodology, amounted to more than 15% of GDP in Croatia, Montenegro, Kosovo and Albania in 2019, where a growing role of tourism is observed throughout the last decade.
Chapter III. Structural indicators - 9. Balance of payments
The pandemic exposed the weakness of health sectors in many CESEE countries, reflecting low levels of funding and remuneration of health professionals. The average monthly gross wage for human health and social work activities was less than the average wage for the total economy in the CIS4, Ukraine, Hungary and Poland in 2019. Ukraine and Hungary posted the largest differentials, of -33.1% and -32.8%, respectively. Many countries have responded to the pandemic by increasing wages for medical workers.
Chapter III. Structural indicators – 5. Average gross monthly wages by activities
The pandemic led to a rapid shift of many activities online, which is likely to accelerate the ongoing digital transformation processes in CESEE. Estonia is a digital front-runner within CESEE but is also at the European and global level. Unsurprisingly, the share of ICT sector value added in GDP (6.6%) in Estonia was the highest among all CESEE countries in 2019. It also grew rapidly over the previous three years, on average by 18.7% in real terms. Rapid annual growth above 10% on average over the same period was also observed in Romania and Hungary. Belarus has also been especially successful in attracting digital innovators and developing a large ICT sector, doubling its share in GDP from 3.1% in 2013 to 6.2% in 2019. Along with Estonia and Belarus, Bulgaria, Romania and the Czech Republic generate more than 5% of their nominal GDP by value added in the ICT sector.
Chapter III. Structural indicators –1. Gross domestic product by activities
Countries covered:
Albania, Belarus, Bosnia and Herzegovina, Bulgaria, Croatia, Czech Republic, Estonia, Hungary, Kazakhstan, Kosovo, Latvia, Lithuania, Moldova, Montenegro, North Macedonia, Poland, Romania, Russia, Serbia, Slovakia, Slovenia, Turkey, Ukraine.
Country groups list: CESEE countries
Pursuing a more environmental-friendly approach in our publications, we offer the 2020 wiiw Handbook of Statistics only in a digital format as a download from our website. It is available in two versions: in PDF format with the most recent years and in Excel format covering the period 1990-2019.
Along with the 2020 Handbook of Statistics, we also grant an access to a new wiiw visual analytics tool called the CESEE Visual Data Explorer. This is connected to our wiiw Annual Database and updated daily. Cross-country comparisons and benchmarking to regional or sub-regional averages can be visualised quickly and easily. Bespoke charts, accompanied by background data, can be created just in few steps by selecting countries, defining the time period, type of chart and preferred layout.
The wiiw statistics department dedicates this edition of the wiiw Handbook of Statistics to our recently deceased colleague and former Deputy Director, Peter Havlik. We are grateful for his permanent support for statistical work at the institute and very valuable assistance in editing and promoting our handbooks throughout many years. Until 2013 he acted as a co-editor of wiiw’s Handbook of Statistics.
We dedicate this handbook also to our dear late colleague Goran Paunovic, whom we lost in the Spring. As a software developer he was responsible for layout and technical production of the wiiw Handbook of Statistics for decades, and with great commitment supported the statistics department in all matters.


