wiiw Handbook of Statistics 2018
18 December 2018
The new edition of the wiiw Handbook of Statisitics 2018 offers a wide range of updated statistics for data-based insights on 22 CESEE economies.
by Alexandra Bykova and Monika Schwarzhappel
The 24th edition of the wiiw Handbook of Statistics contains key macroeconomic and structural indicators for 22 economies in Central, East and Southeast Europe (CESEE), serving as an easy-to-use reference tool and facilitating comparisons across topics, countries and time. It is an important source of information for researchers, analysts with multinational corporations and banks, managers and policy-makers with a strategic interest in CESEE.
Key features include:
- Comprehensive macroeconomic data for 22 countries in CESEE;
- Broad range of indicators, covering growth, labour markets, wages and prices, government accounts, external accounts, finance, and population data;
- Granular breakdowns of key data points, including export structure by product and partner country;
- Data from 1990 to 2017 providing a full overview of the processes of transition and convergence in the region;
- Comparisons between countries in the region, and with the EU, USA and Japan;
- Ready-made tables and maps for key indicators;
- More extensive and detailed data on peripheral CESEE economies than comparable databases.
New features of the 2018 edition:
- Graphs on key indicators at the regional level highlight the most recent trends
- Wages and investment data by activities now also available for Turkey
- Comparable structural breakdown (NACE Rev. 2) now available for all countries (for Russia only partial data are available for the last two years)
Example tables and maps for each chapter can be viewed for free here: PDF or Excel tables.
Key numbers behind strong performance of the CESEE region in 2017
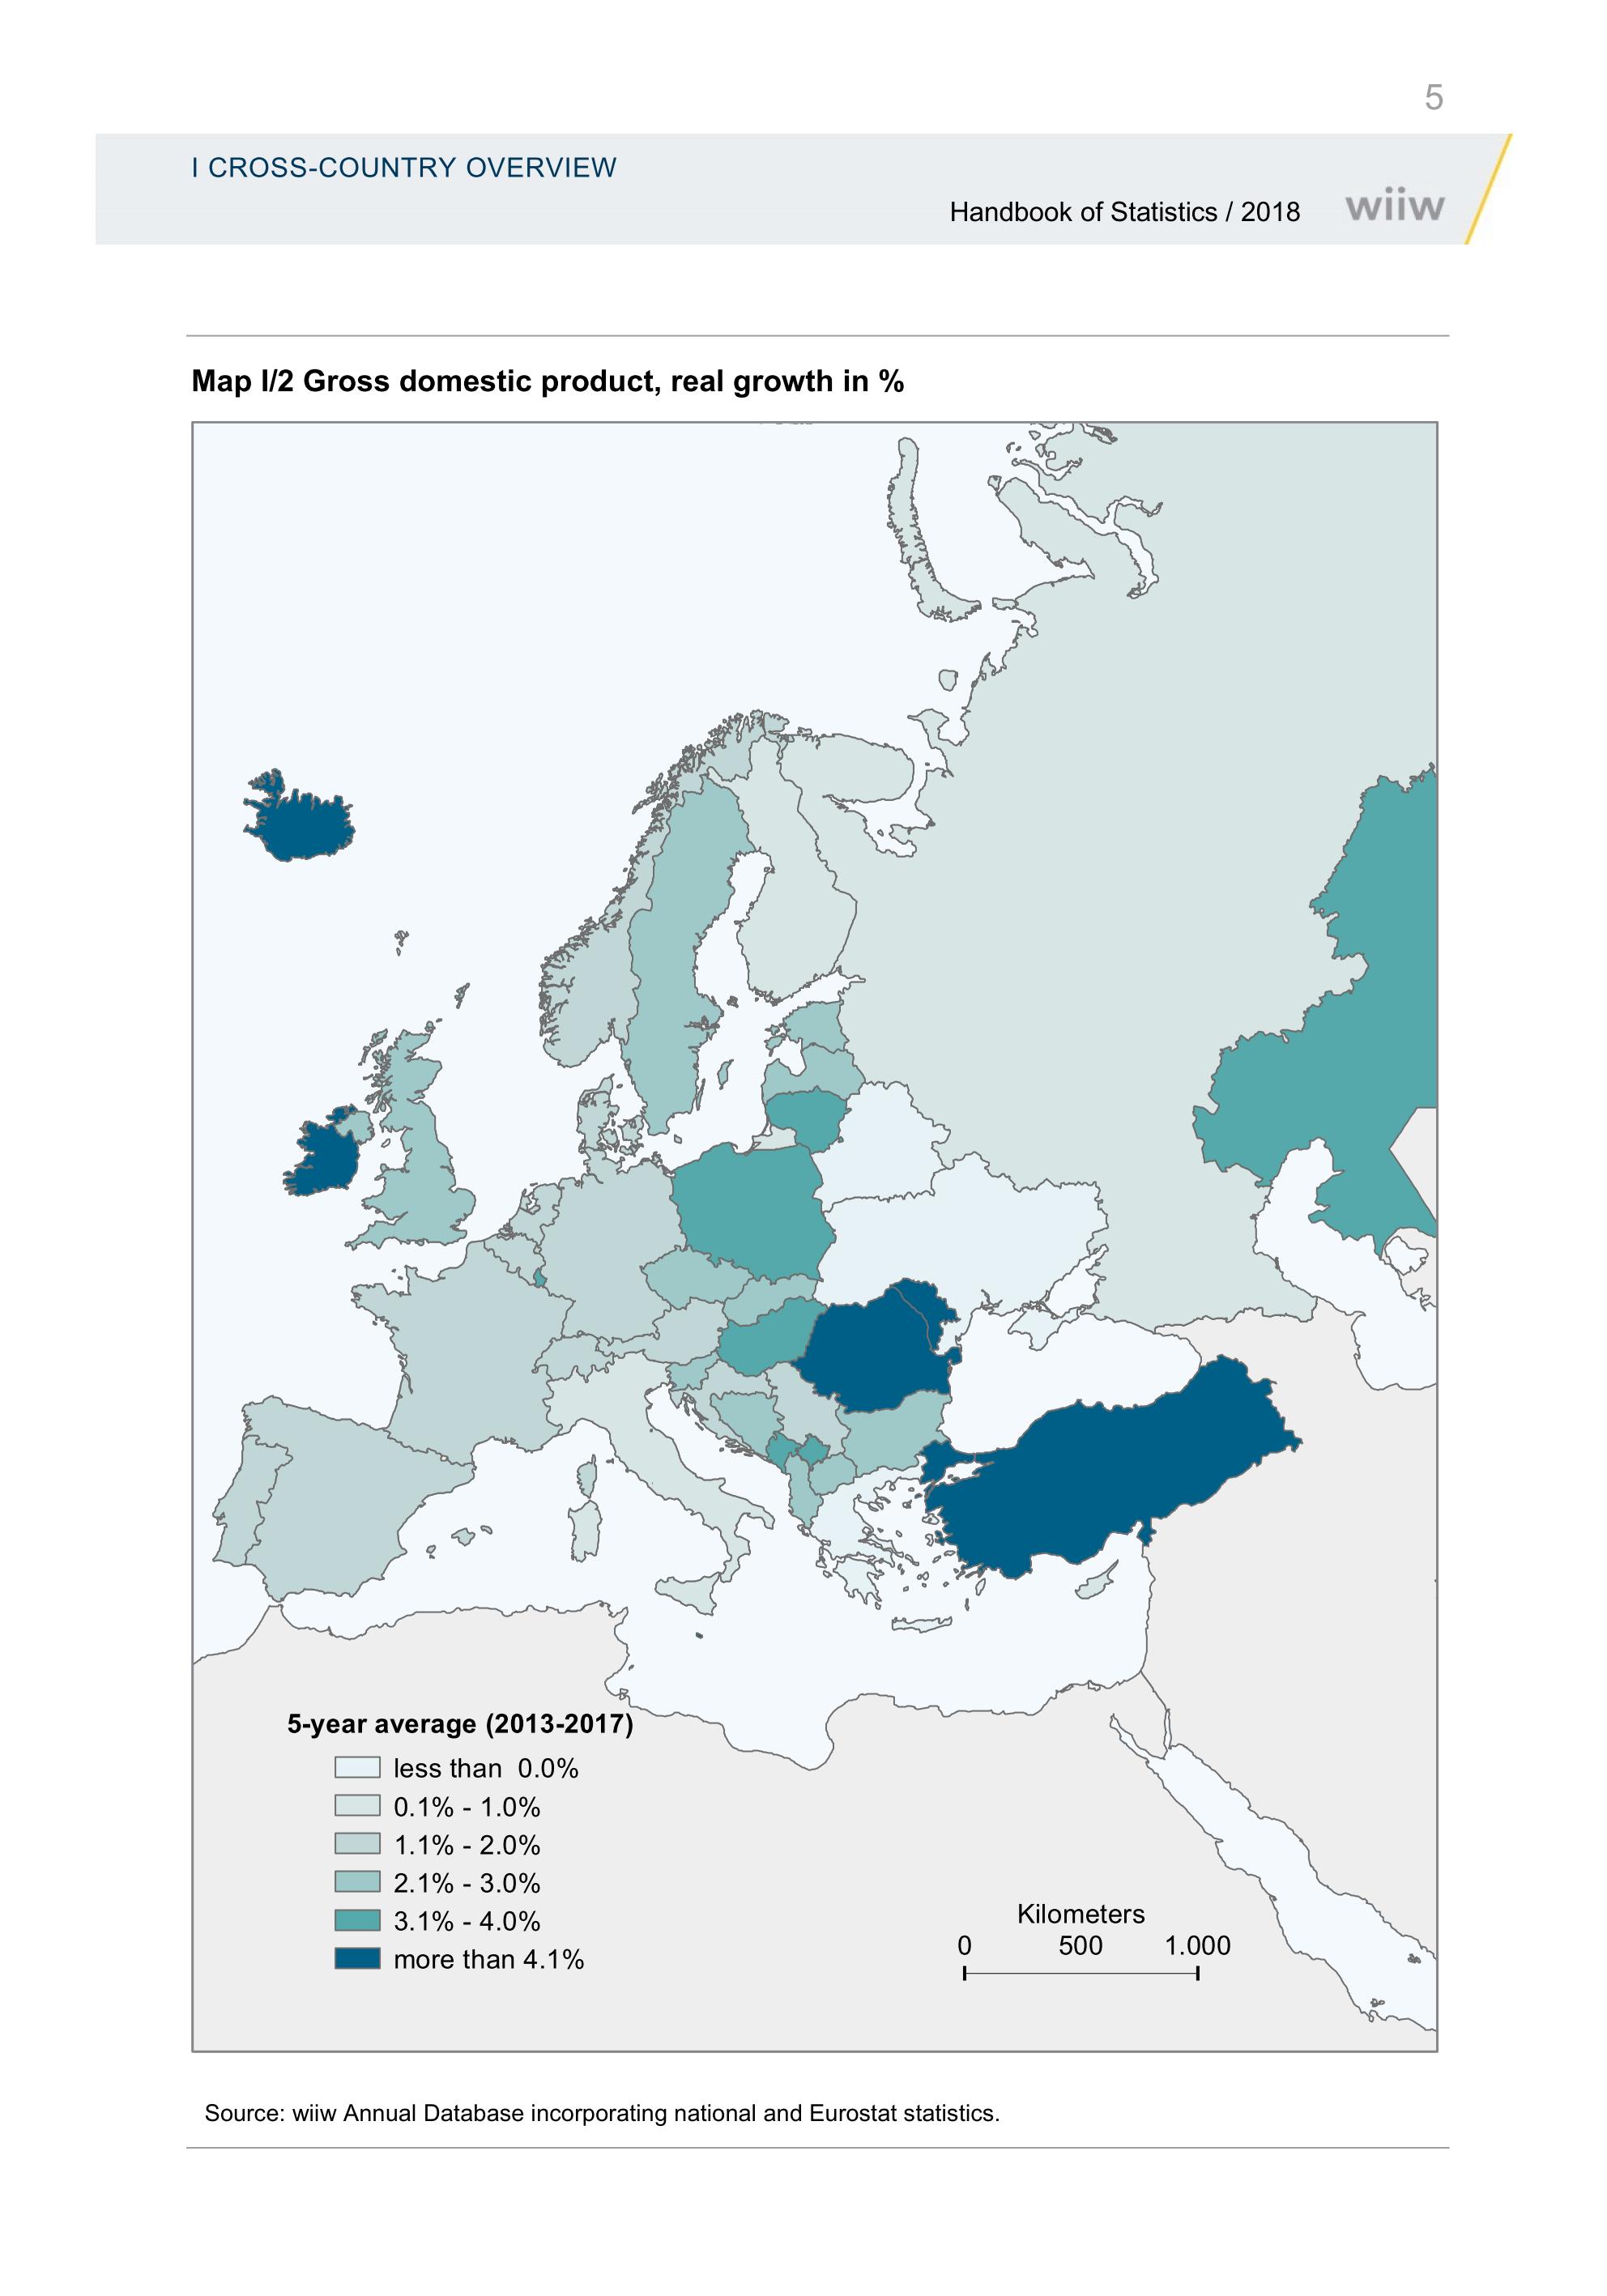
All countries in CESEE experienced positive economic growth in 2017, with ten of them achieving their highest real GDP growth rates over the last 5 years. Among sub-regions the clear leader was EU-CEE with average real GDP growth of 4.9 %, profiting from domestic demand expansion, favourable external conditions, robust growth of Germany (a key trading partner for all of them), and inflows of EU funds for investment. Romania was the top performer in CESEE for the second year in a row, growing by 7.3%, despite rising concerns about overheating.
Convergence with Western Europe continued for most of CESEE, backed by widening growth rates differentials. For the whole of CESEE the average growth rate in 2017 was 1.7 percentage points higher than in EU15, with the Visegrád countries (VIS4) and the Baltic countries (BAL3) outpacing EU15 on average by 2.2 and 2.1 percentage points respectively. The deceleration of catching up in the non-EU Western Balkans (WB6) is explained by the weak performance of Serbia and Macedonia in 2017. Russia fell further behind the EU15 in 2017, recording the second lowest growth rate in the whole of CESEE (1.5%). This means a fourth consecutive year of weaker growth for Russia than the EU15.
Detailed statistics on GDP real growth rates see:
Chapter I. Cross-country overview, Table I/2 / Gross domestic product, real growth
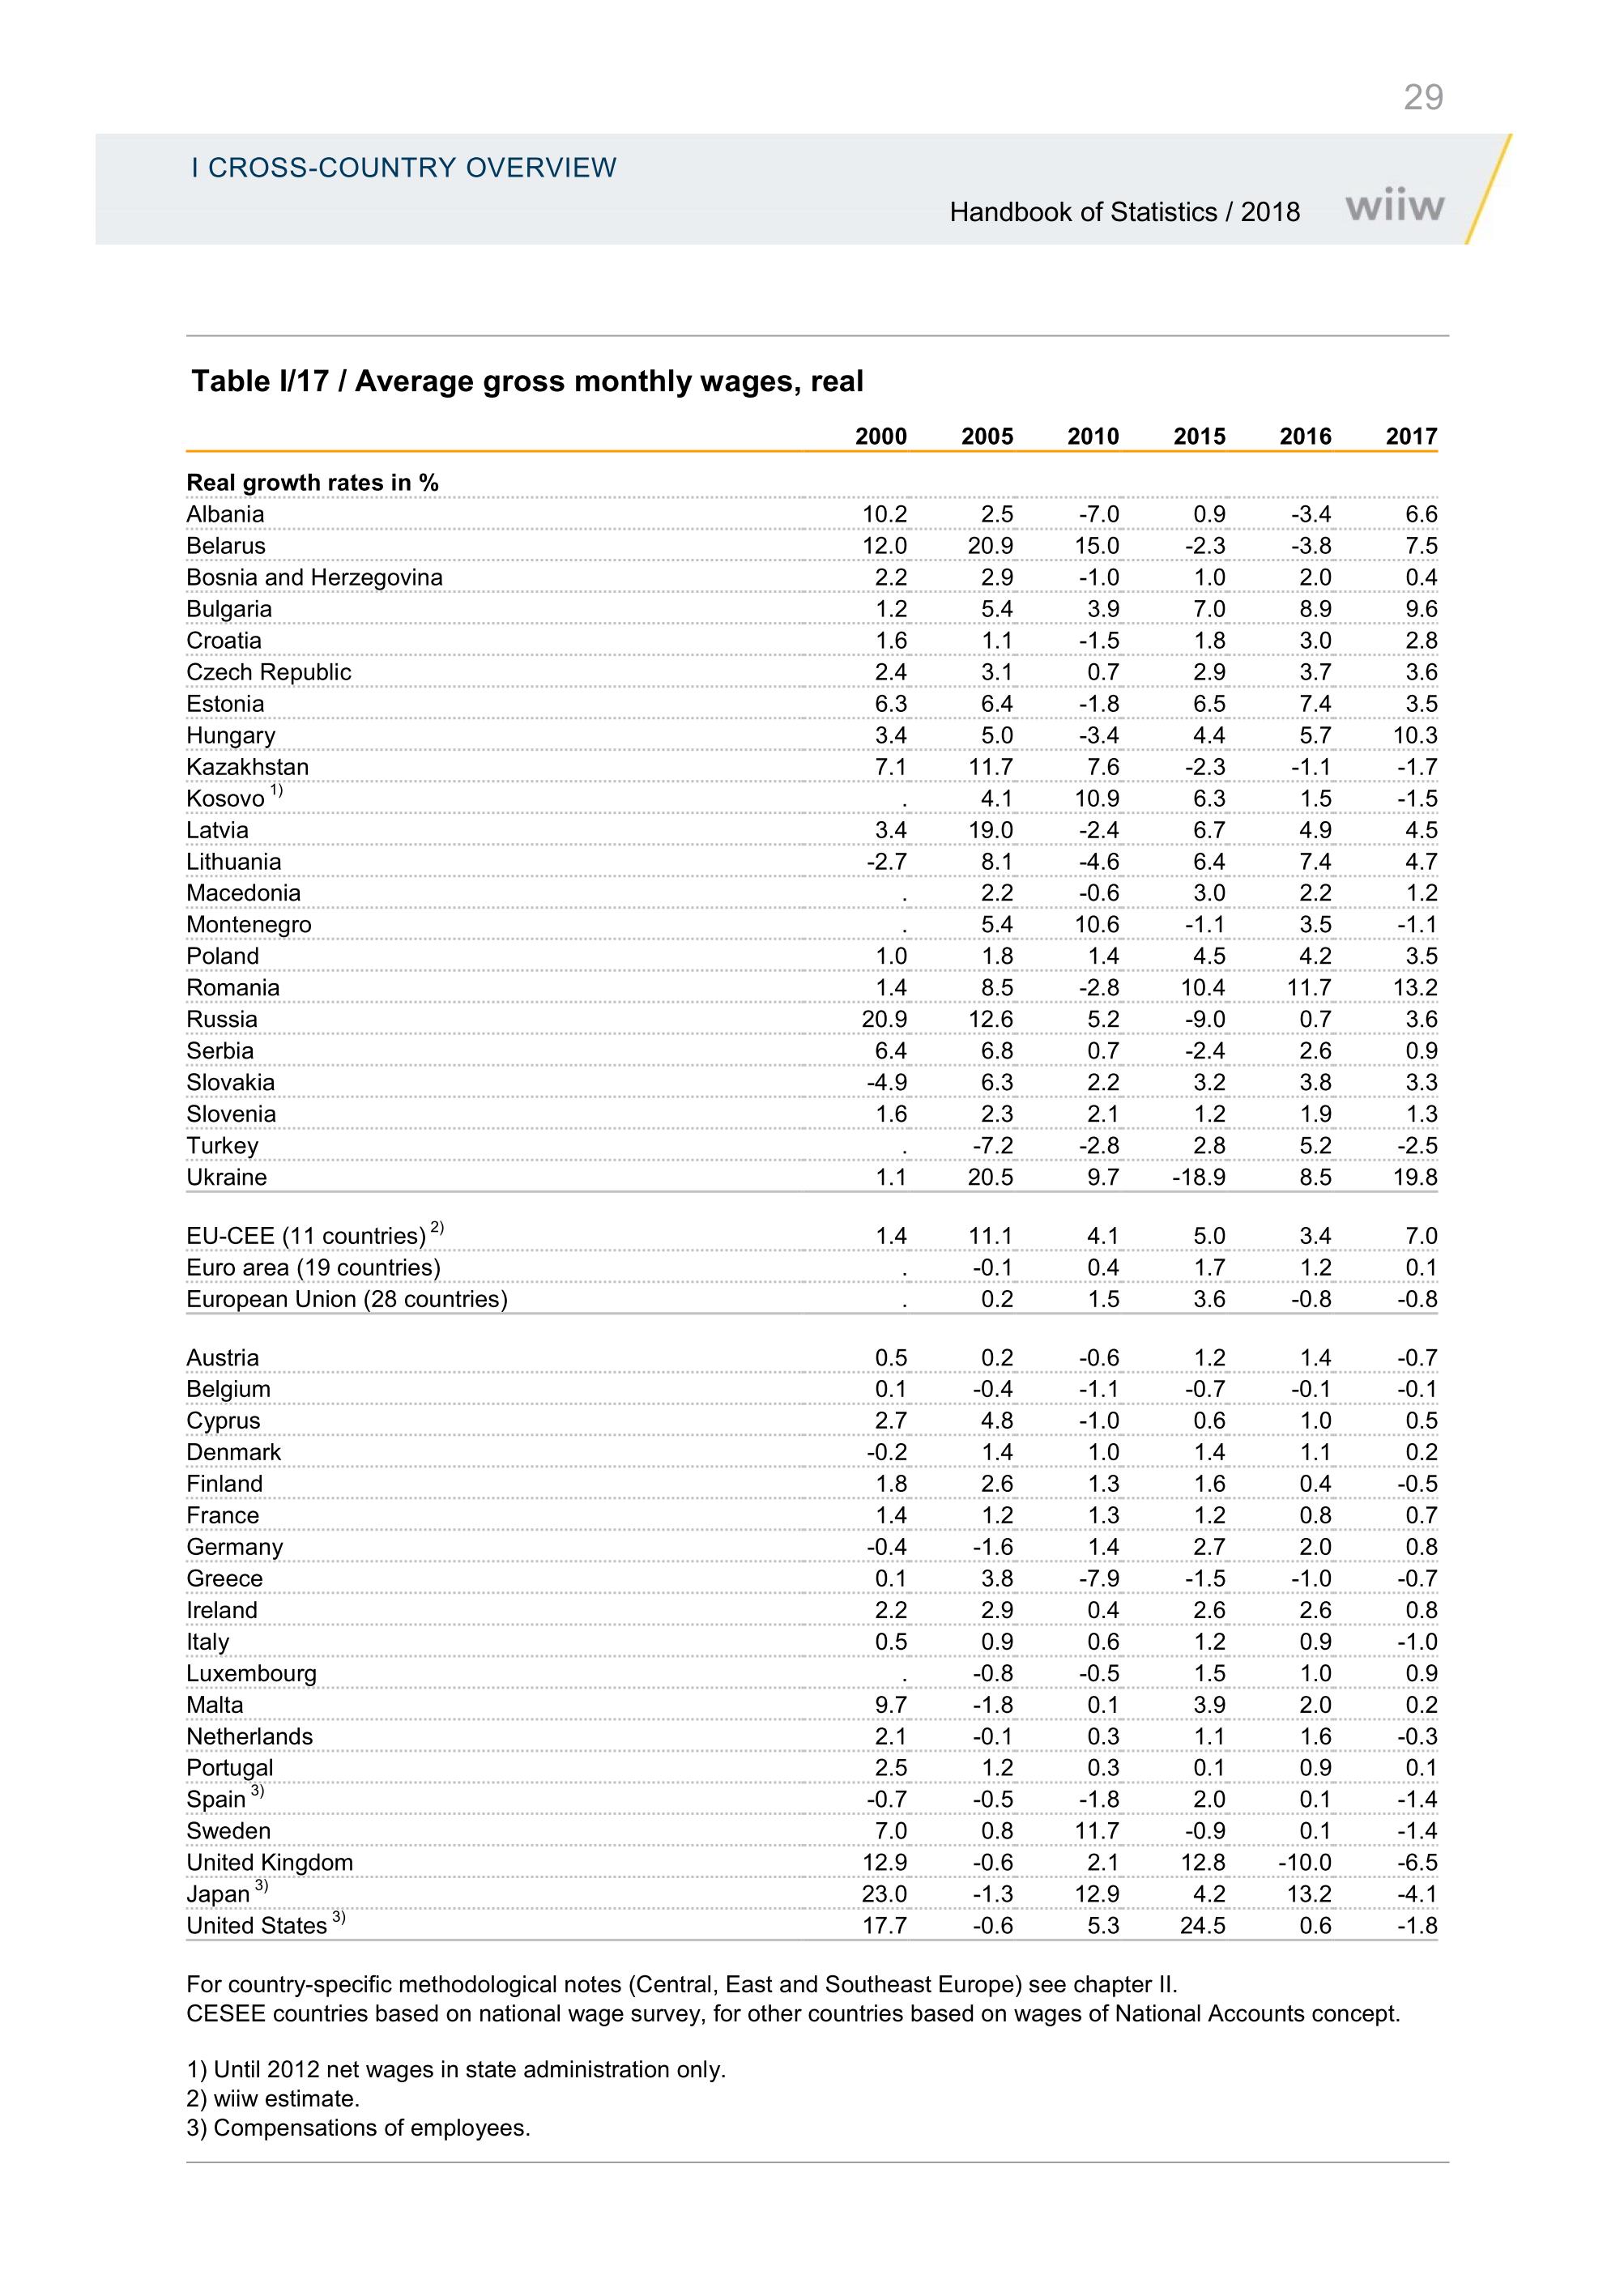
Strong domestic demand was supported in 2017 by high real wages growth in most CESEE countries, especially in comparison with Western EU and many other economies around the world. Whereas for Ukraine double-digit growth compensated for the decline of a similar magnitude two years ago (following the minimum wage hike in 2017), for Romania and Hungary the increase can be explained by tight labour markets conditions and government policy, including minimum wages rise as well. On the sub-regional level EU-CEE recorded the strongest increases in real earnings. Wages rose due to better bargaining positions of workers, related to tight labour market in these countries, boosting consumption and domestic demand. Although average wage levels are still lower than in Western EU countries, rising unit labour costs are an early warning signal of concerns about future investment and production growth.
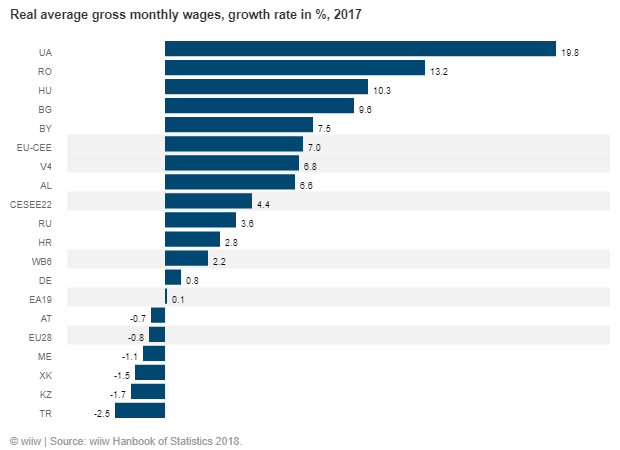
Comparison with other countries: Chapter I. Table I/17 / Average gross monthly wages, real
More structural data on wages: Chapter III. Structural indicators - 5. Average gross monthly wages by activities
The year 2017 in historical perspective: still potential to unlock in the region
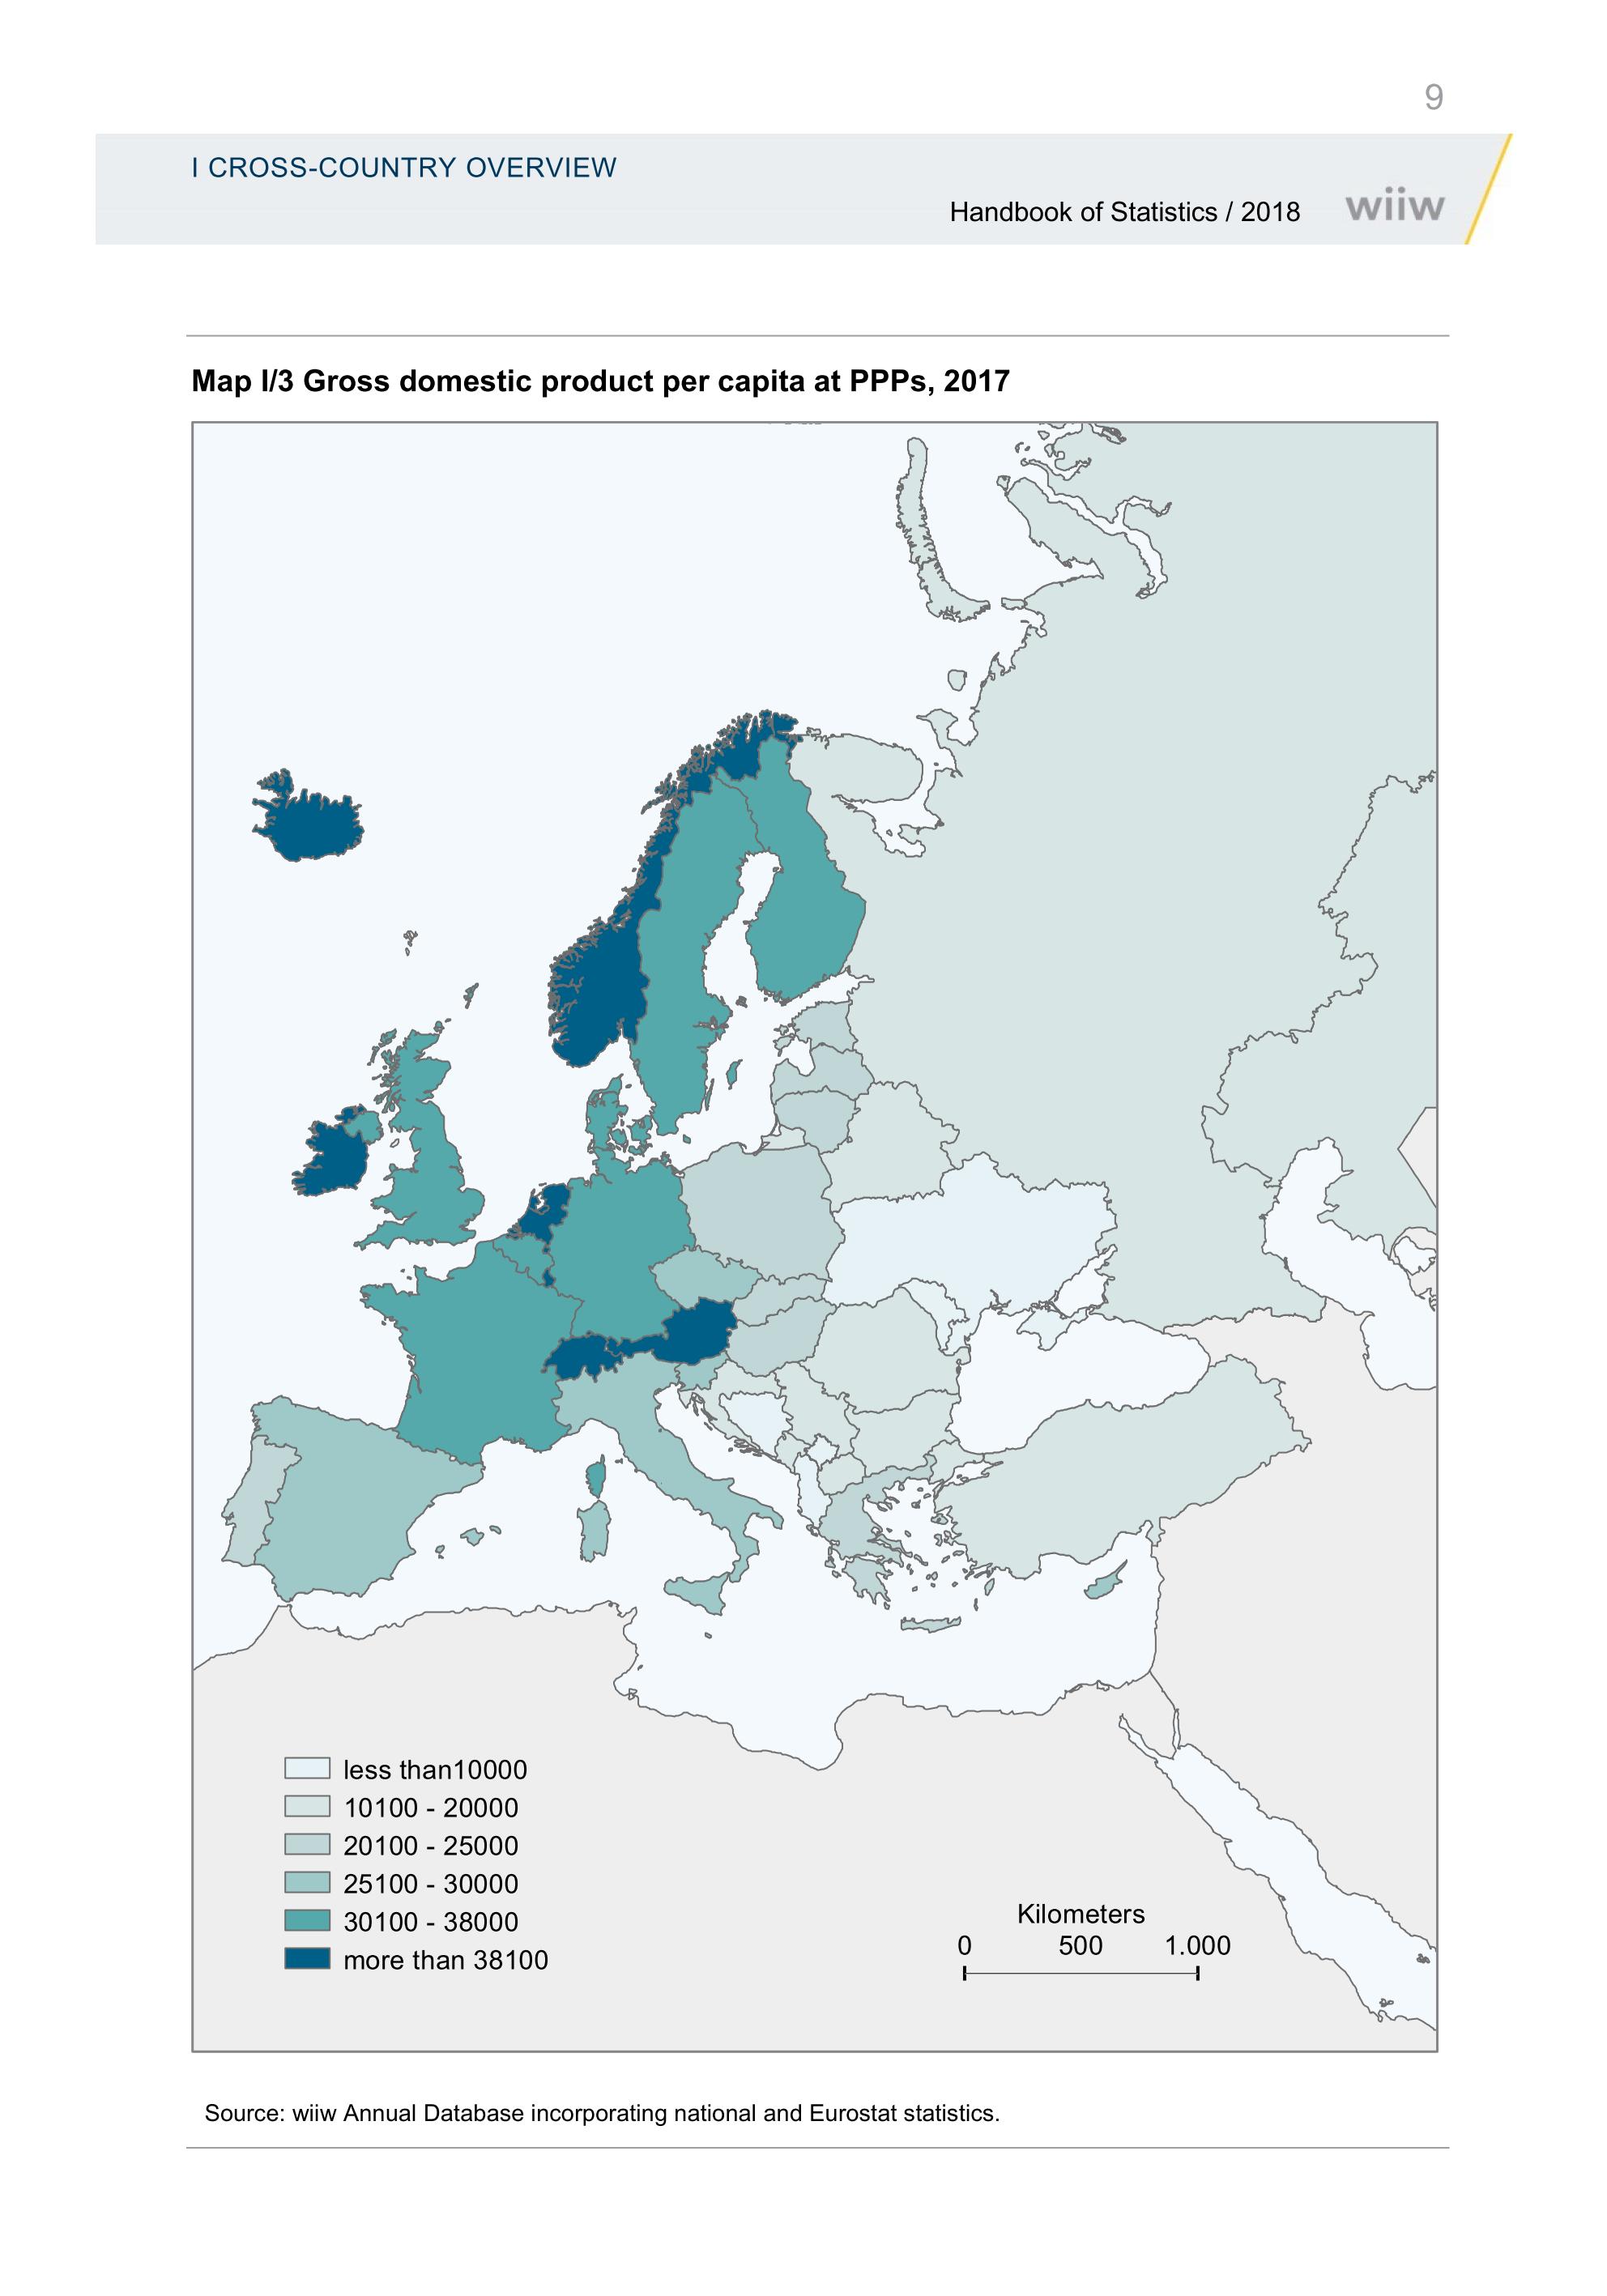
The convergence process is proceeding at a moderate rate. The lowest income gaps in terms of GDP per capita at PPP relative to the EU-28 average are observed in the EU-CEE sub-region. The Baltic countries and the Visegrád countries led the way in 2017, (at 26 and 27 percentage points, respectively, below the average EU28 level).
Most countries in CESEE have narrowed the income gap with EU28 average over last ten years, but regional disparities are substantial. While EU-CEE has gained about 9.9 percentage points, the WB6 on average have achieved 3.0 percentage points of convergence, and the CIS3 and Ukraine only 0.8 percentage points increase. The WB6 and CIS and Ukraine remained significantly poorer, with GDP per capita at PPP at 33.7 % and 53.3% of the EU28 level, respectively in 2017.
Detailed statistics on countries: Chapter I. Table I/6 / Gross domestic product per capita at PPPs relative to EU-28
Among countries in CESEE covered by wiiw the main success stories of the last five years in terms of convergence were Lithuania, Romania and Montenegro, which gained 8.7, 8.6 and 6.9 percentage points, respectively, against the EU28 average income level over the period. Only four countries fell back - Albania, Ukraine, Belarus and Russia lost 1.1, 4.2, 5.1 and 10.6 percentage points, respectively, versus the EU28 average over the same period.
At the end of 2017 the Czech Republic, with 88% of the average EU28 income level, had the narrowest gap to close. Ukraine had the longest way to go with only 21% of the EU28 GDP per capita at PPP.
More detailed statistics: Chapter I. Table I/6 / Gross domestic product per capita at PPPs relative to EU-28
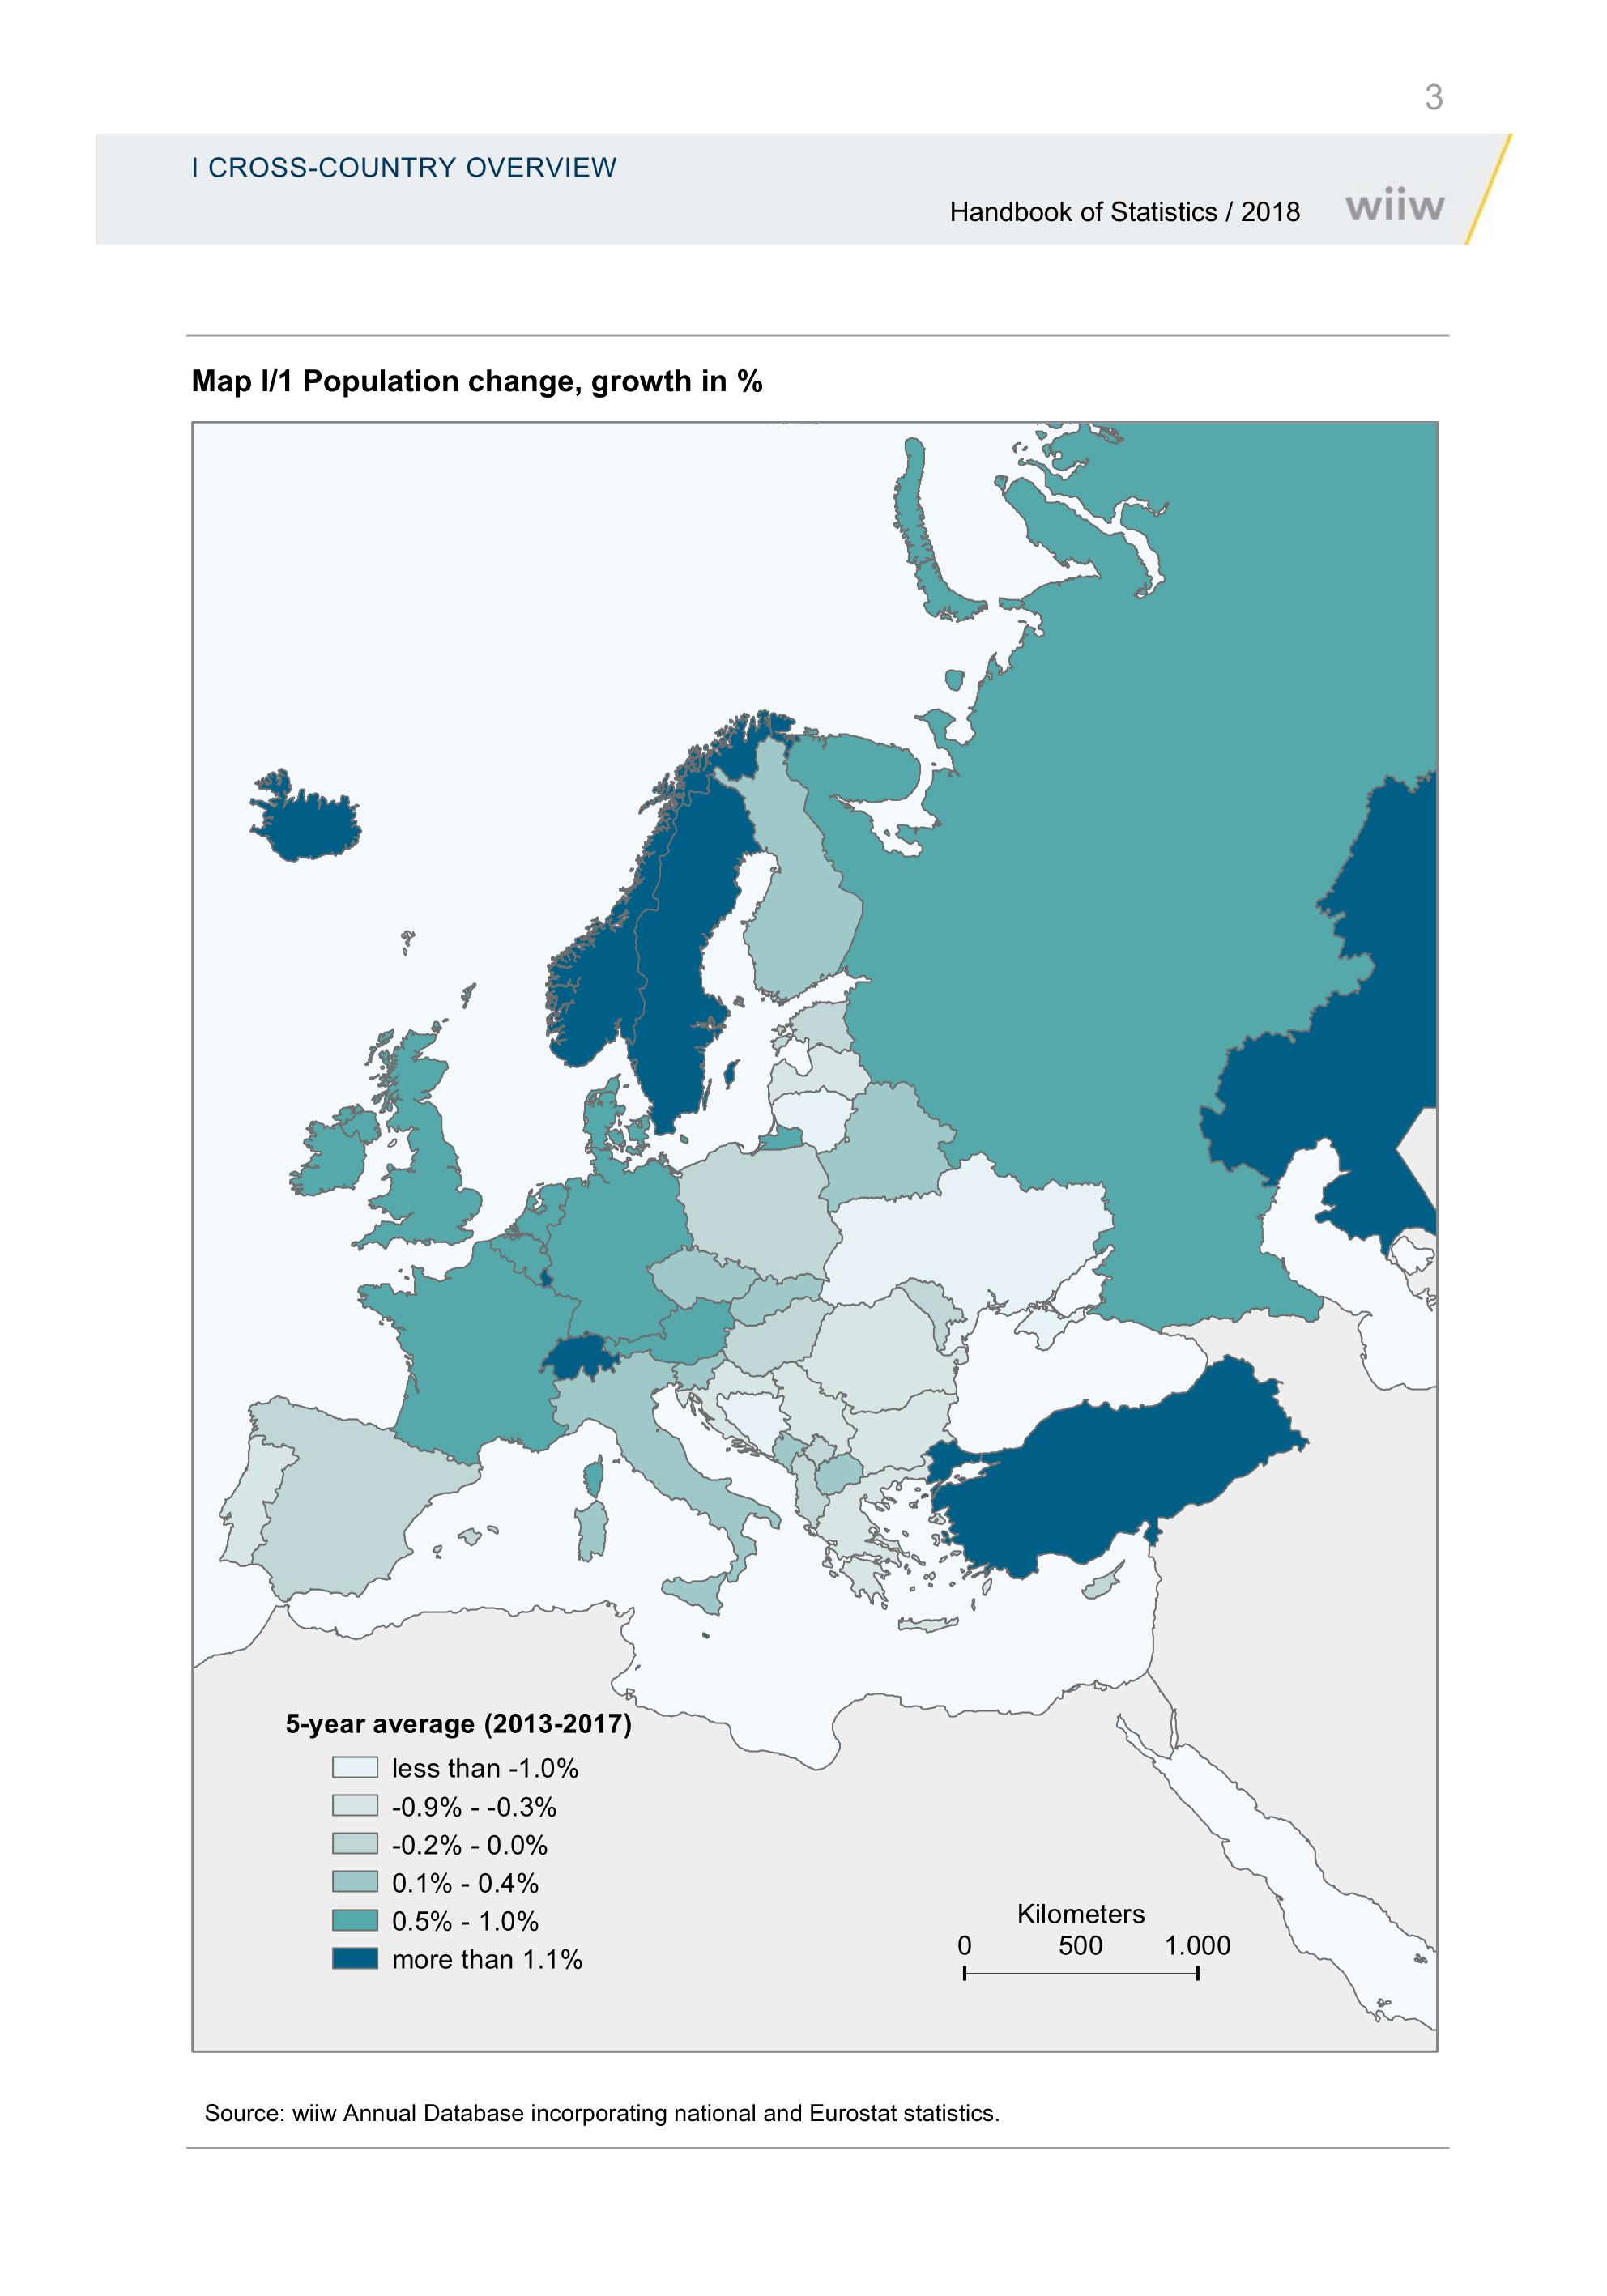
Demographic factors are significant for shaping the convergence processes. In EU-CEE and the WB6 sub-regions the population is declining, with one of the reasons being emigration to wealthier EU countries. EU Member States in the region have experienced a population decline of more than 3% over the last decade and a half. By contrast, non-EU Member States’ population grew by 4% over the same period. Population shrinkage in EU-CEE had various economic and political effects and not all of them were negative, a decline in unemployment being one example.
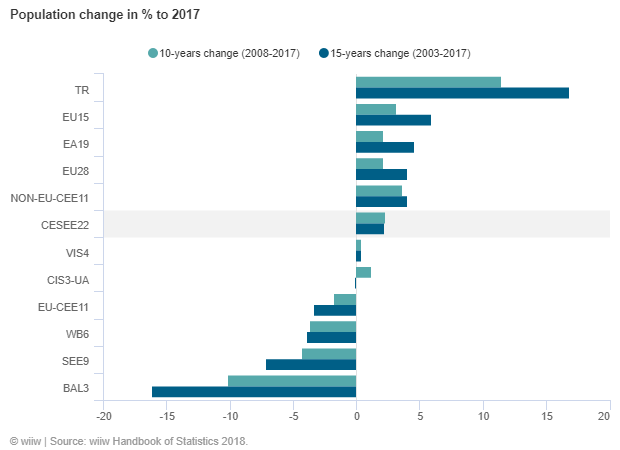
For cross-country comparisons see Chapter I. Cross-country overview, Table I/1 / Population
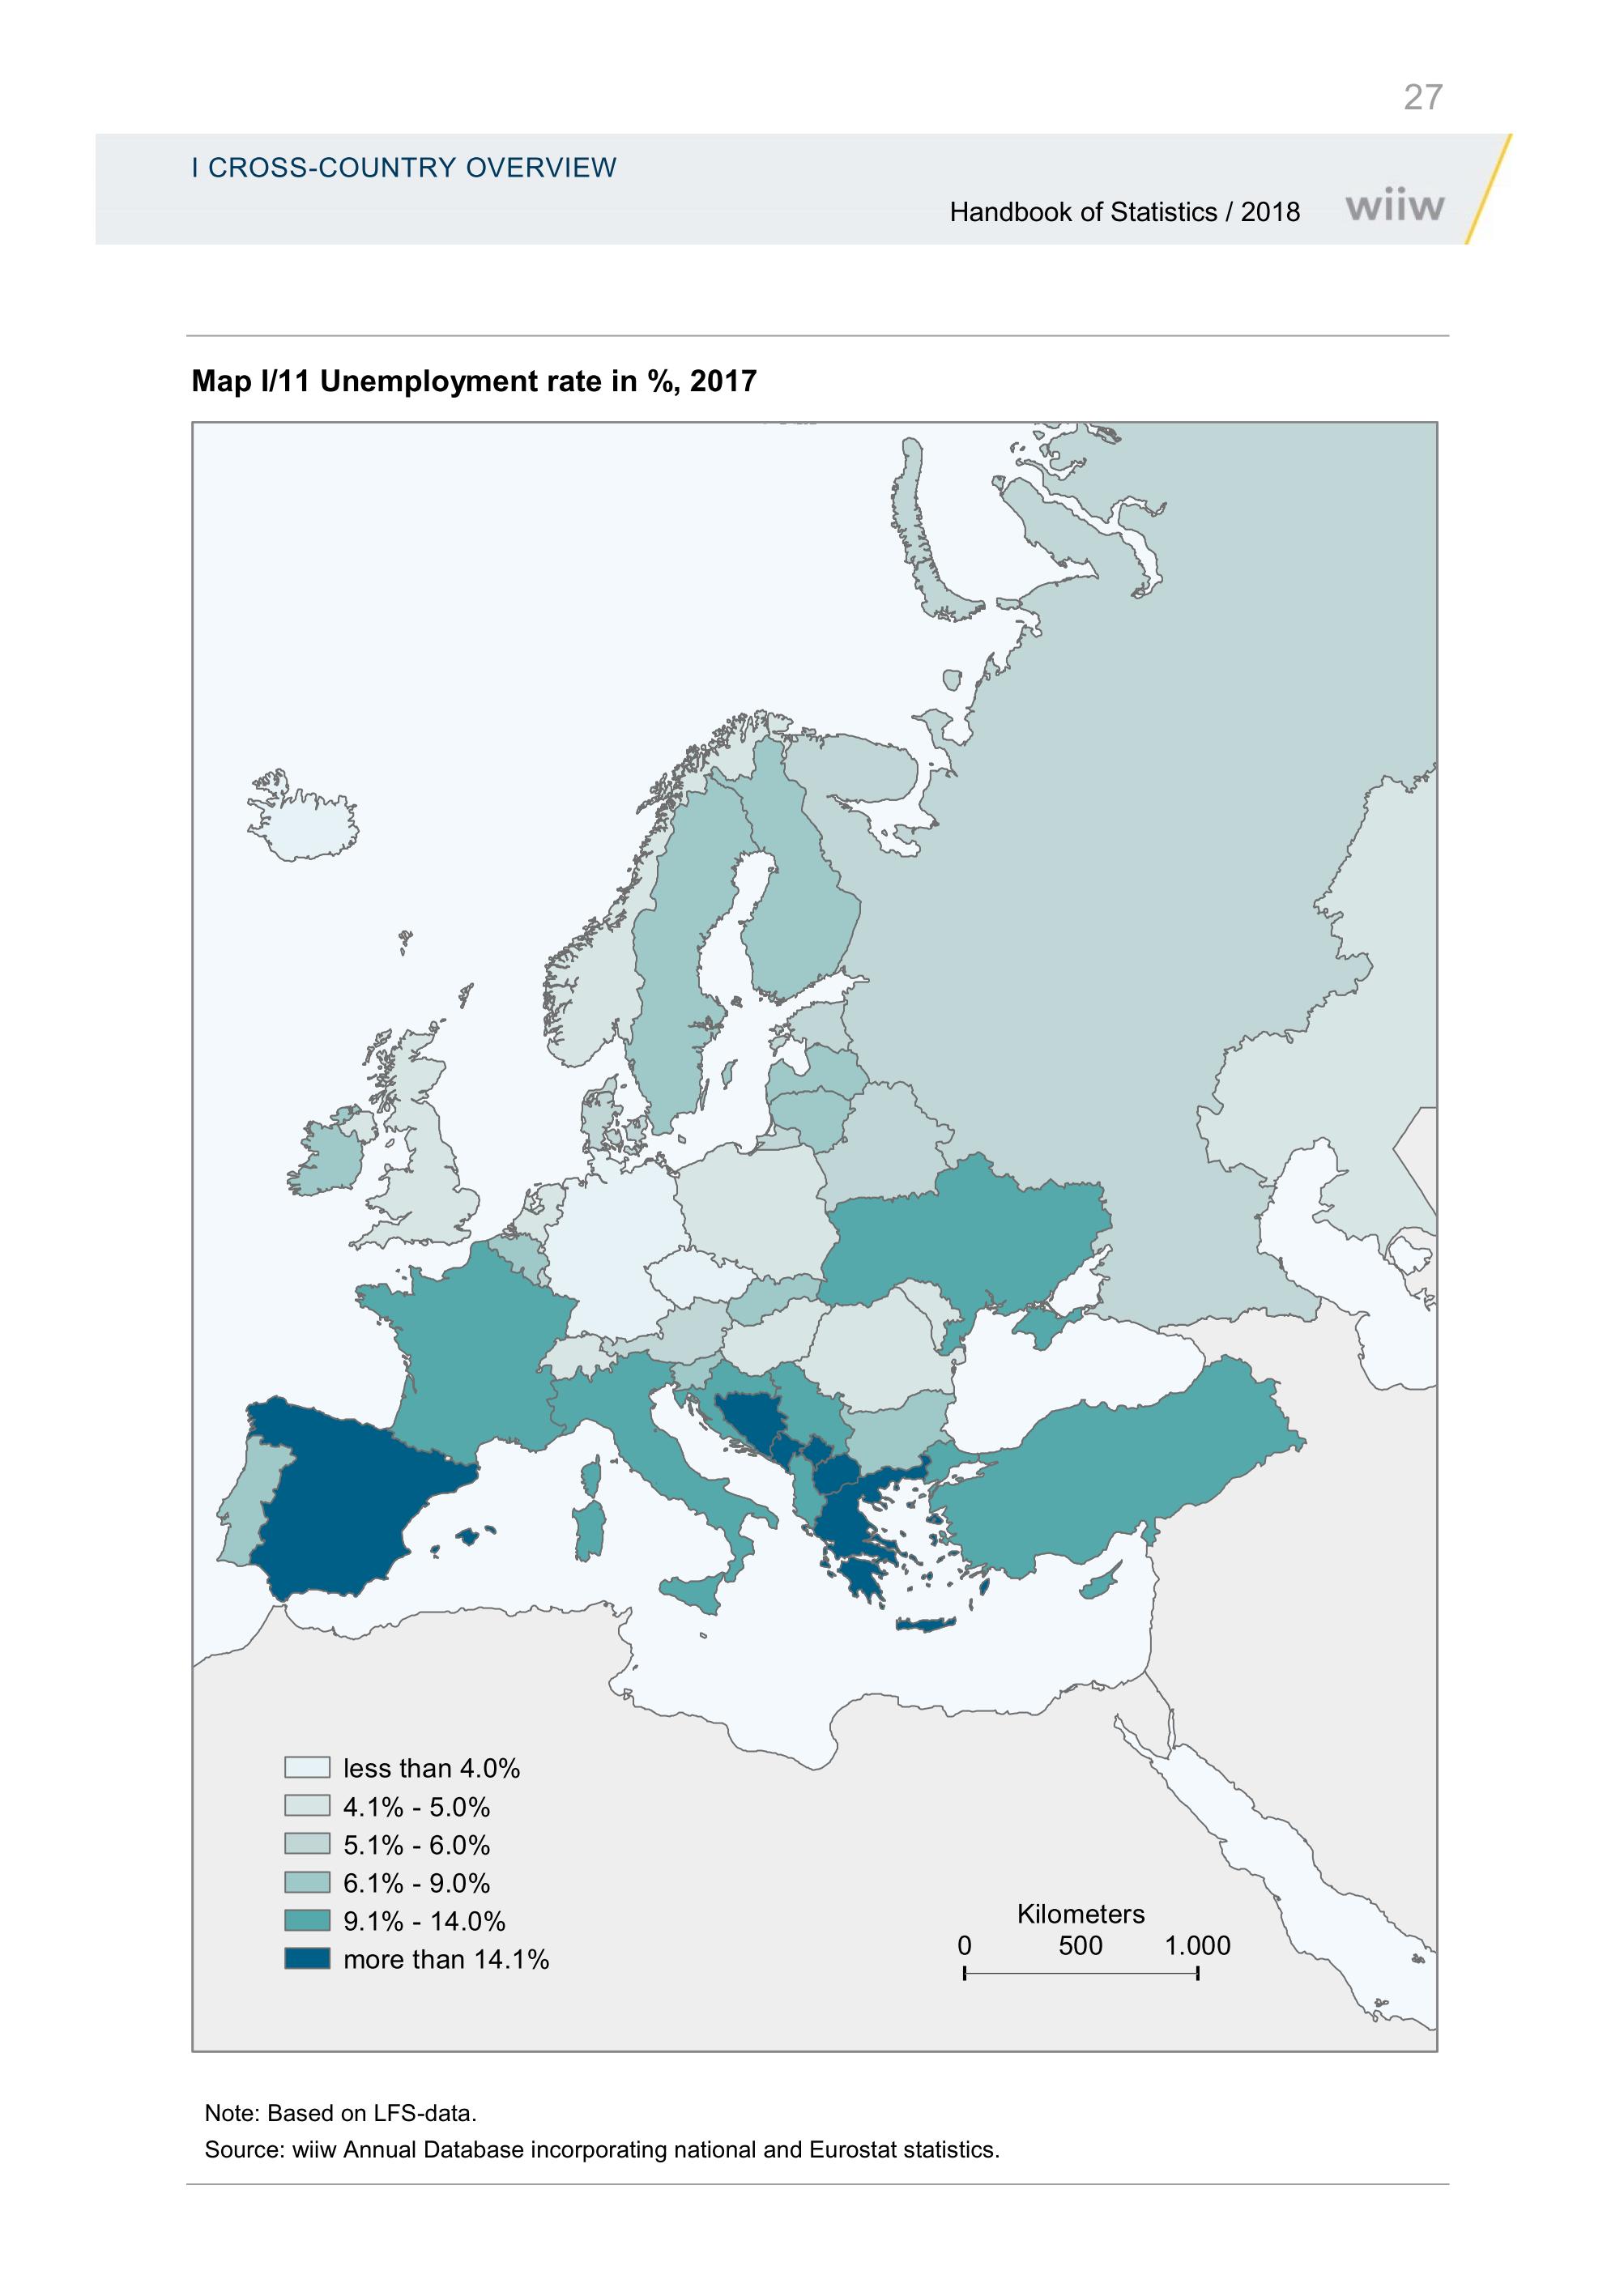
Labour market tightening in 2017 in comparison to the previous year is clearly reflected in falling unemployment rates in almost all CESEE countries (except Ukraine and Kosovo). The longer time span delivers a more differentiated picture, however (see map below).
Unemployment rates in nine of 22 economies covered by wiiw are higher than pre-crisis levels. These nine countries include Albania and Croatia, countries with double-digit unemployment rates of 13.7% and 11.2% respectively. Among countries with very high unemployment rates Kosovo, Macedonia and Bosnia and Herzegovina have achieved the most progress over last decade, with the unemployment rate falling by 17, 11.4 and 2.9 percentage points respectively.
For cross-country comparisons see Chapter I. Cross-country overview, Table I/15 / Unemployment rate - LFS
What do the numbers tell us about the future?
Uncertainty regarding external shocks such as weakness in the Eurozone, US trade policy, Brexit, a cooling down phase of the business cycle as well as more longer-term structural changes such as the emergence of the new digital economy could all be challenging for the sustainability of the current positive economic performance. Statistical indicators presented in the 2018 Handbook of Statistics clearly demonstrate the diversity of countries in CESEE region regarding the magnitude of exposure to different types of risks, resilience potential and level of preparedness for the new digital economy.
Direct effects from a trade conflict between the USA and China for most countries in CESEE via the export channel are low. Turkey has the highest export exposure to the US, at 5.5% of the total. Kazakhstan and Russia have double-digit shares for China in their total exports of goods: 12% and 10.9%, respectively. However, other economies could be affected through knock-on effect via their main trading partners.
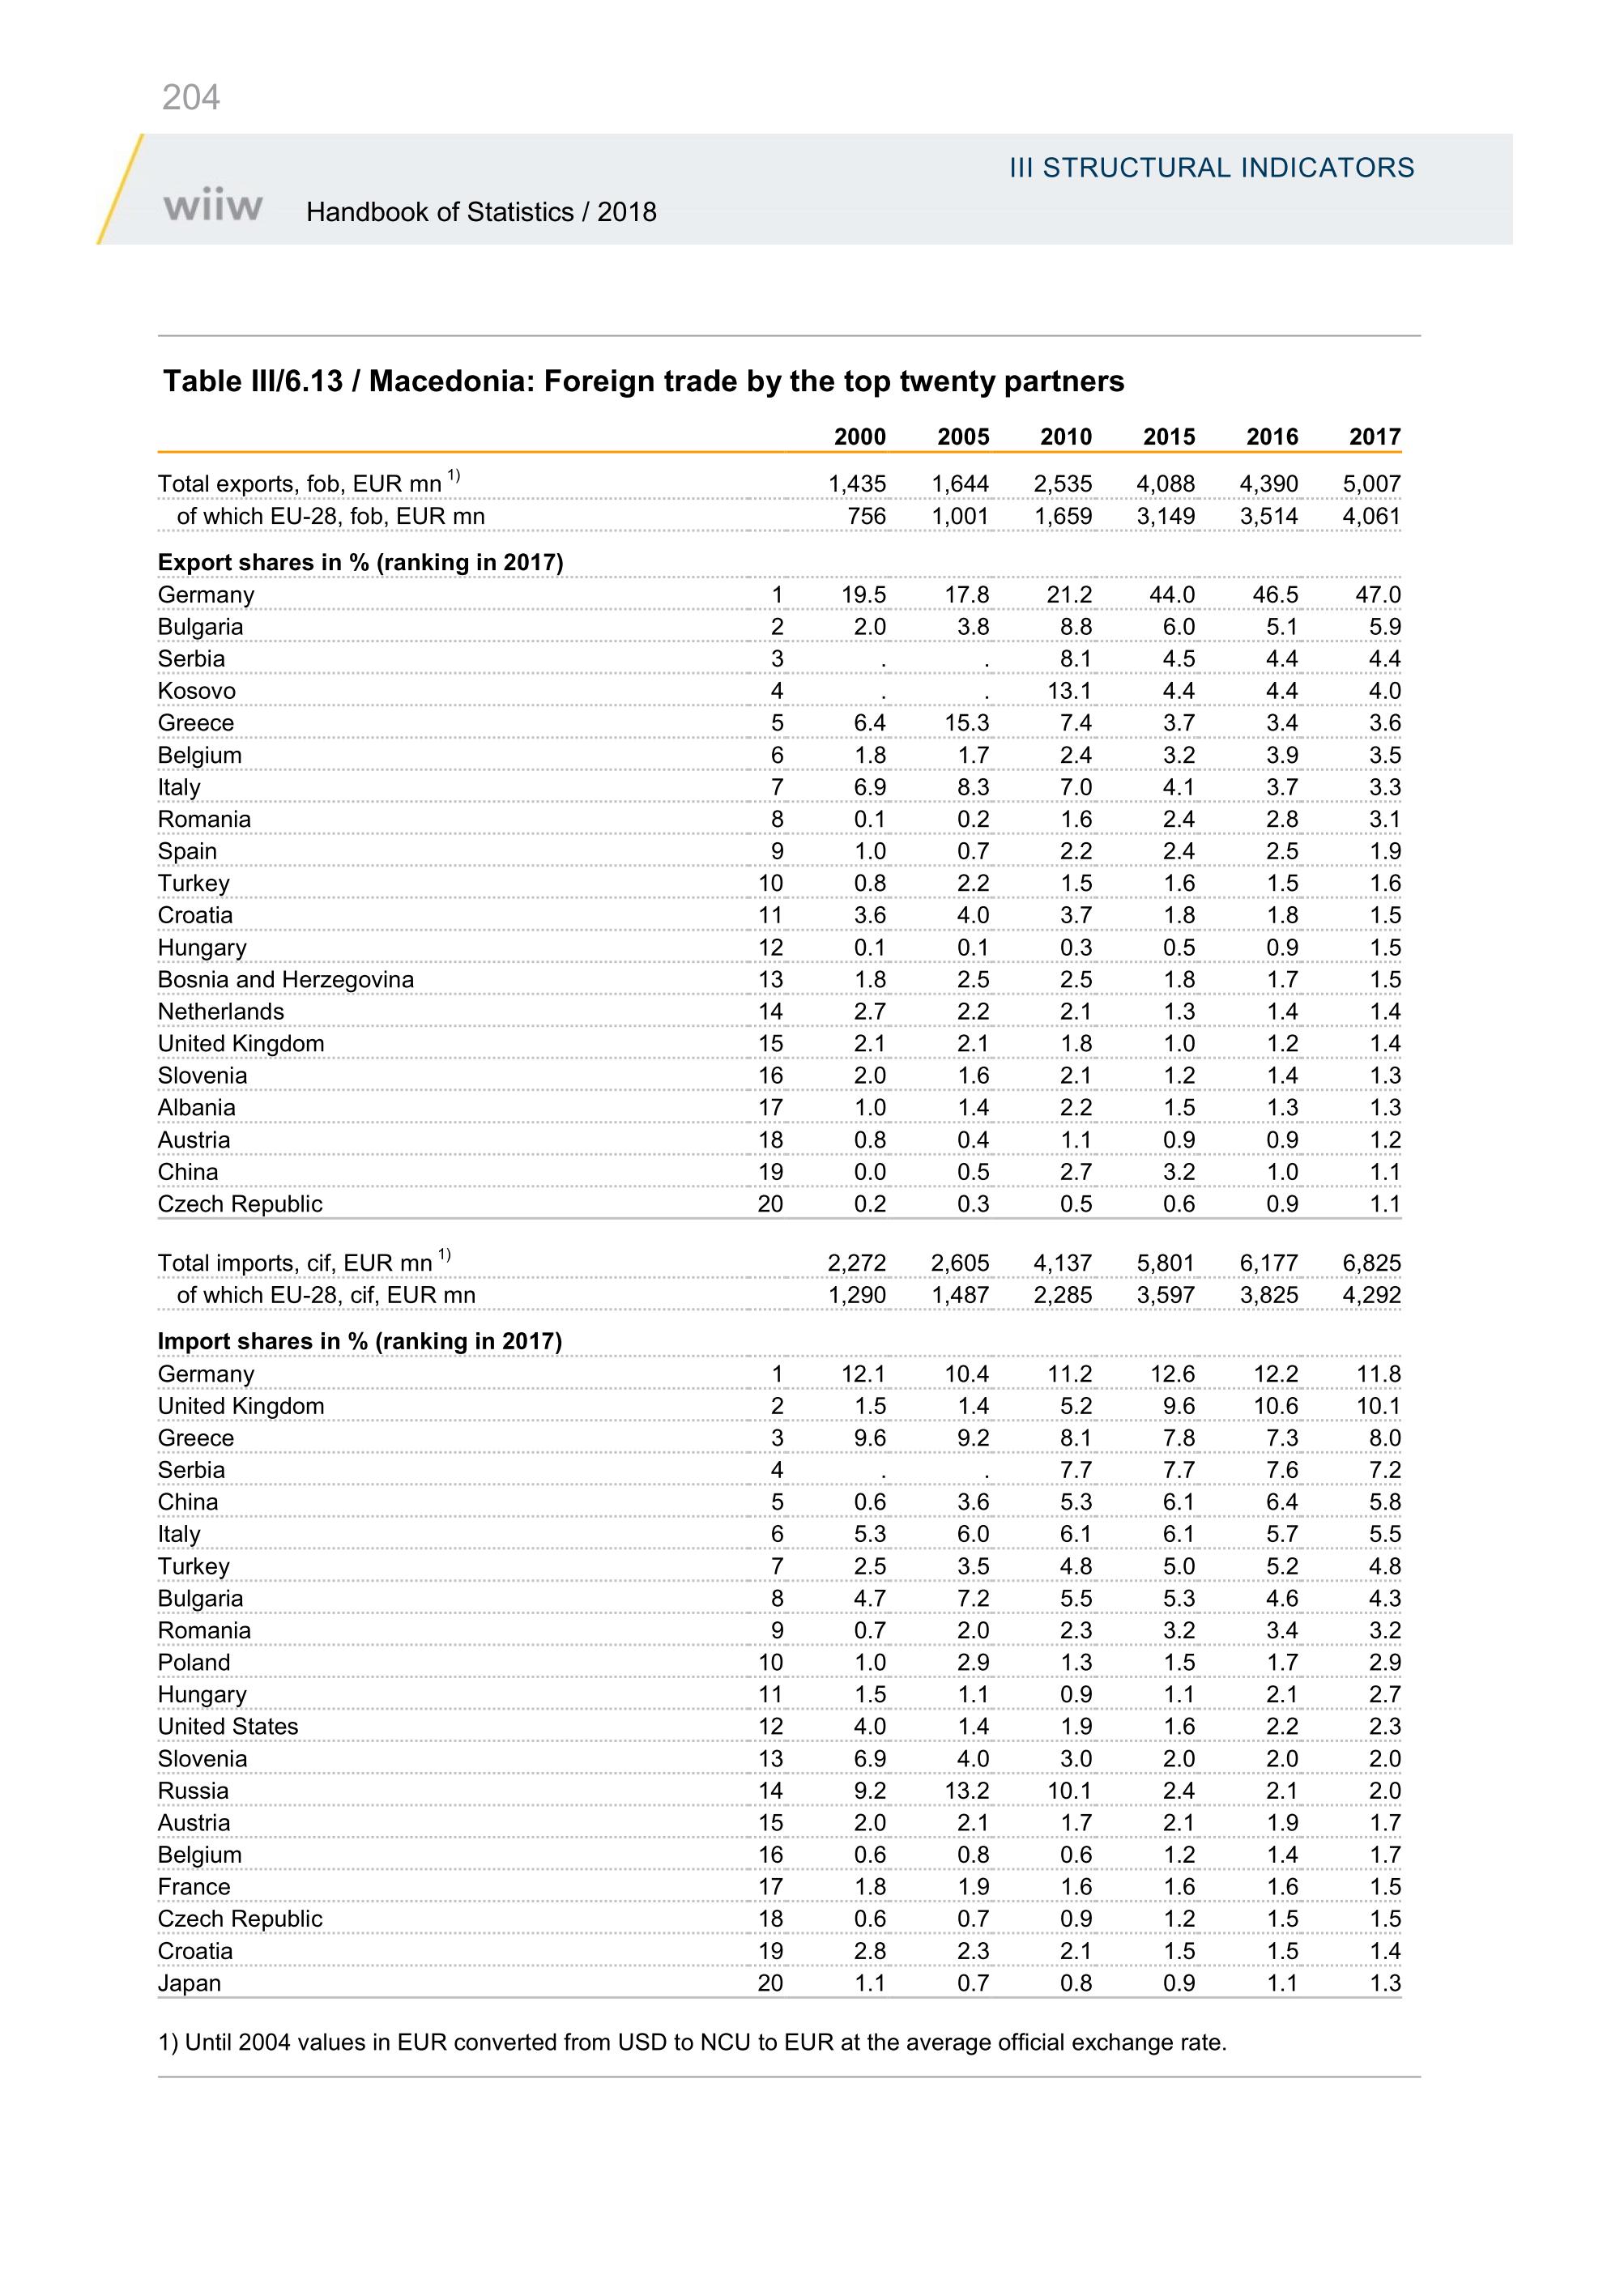
Deeper integration of CESEE economies into Western and Central European manufacturing supply chains increase their dependence on Germany’s economic performance (and therefore indirectly to global developments, including the US-China trade conflict). Macedonia, Hungary and the Czech Republic are most vulnerable owing their openness to exports and the significant share of Germany as an export destination. Kazakhstan, Montenegro and Kosovo seem to be least exposed.
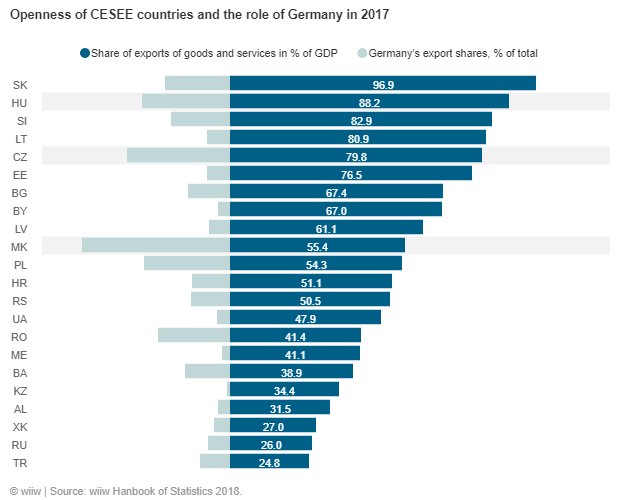
More detailed data on foreign trade by partner: Chapter III. Structural indicators - 6. Foreign trade by partners
More detailed data on foreign trade by product groups: Chapter III. Structural indicators - 7. Foreign trade by commodities
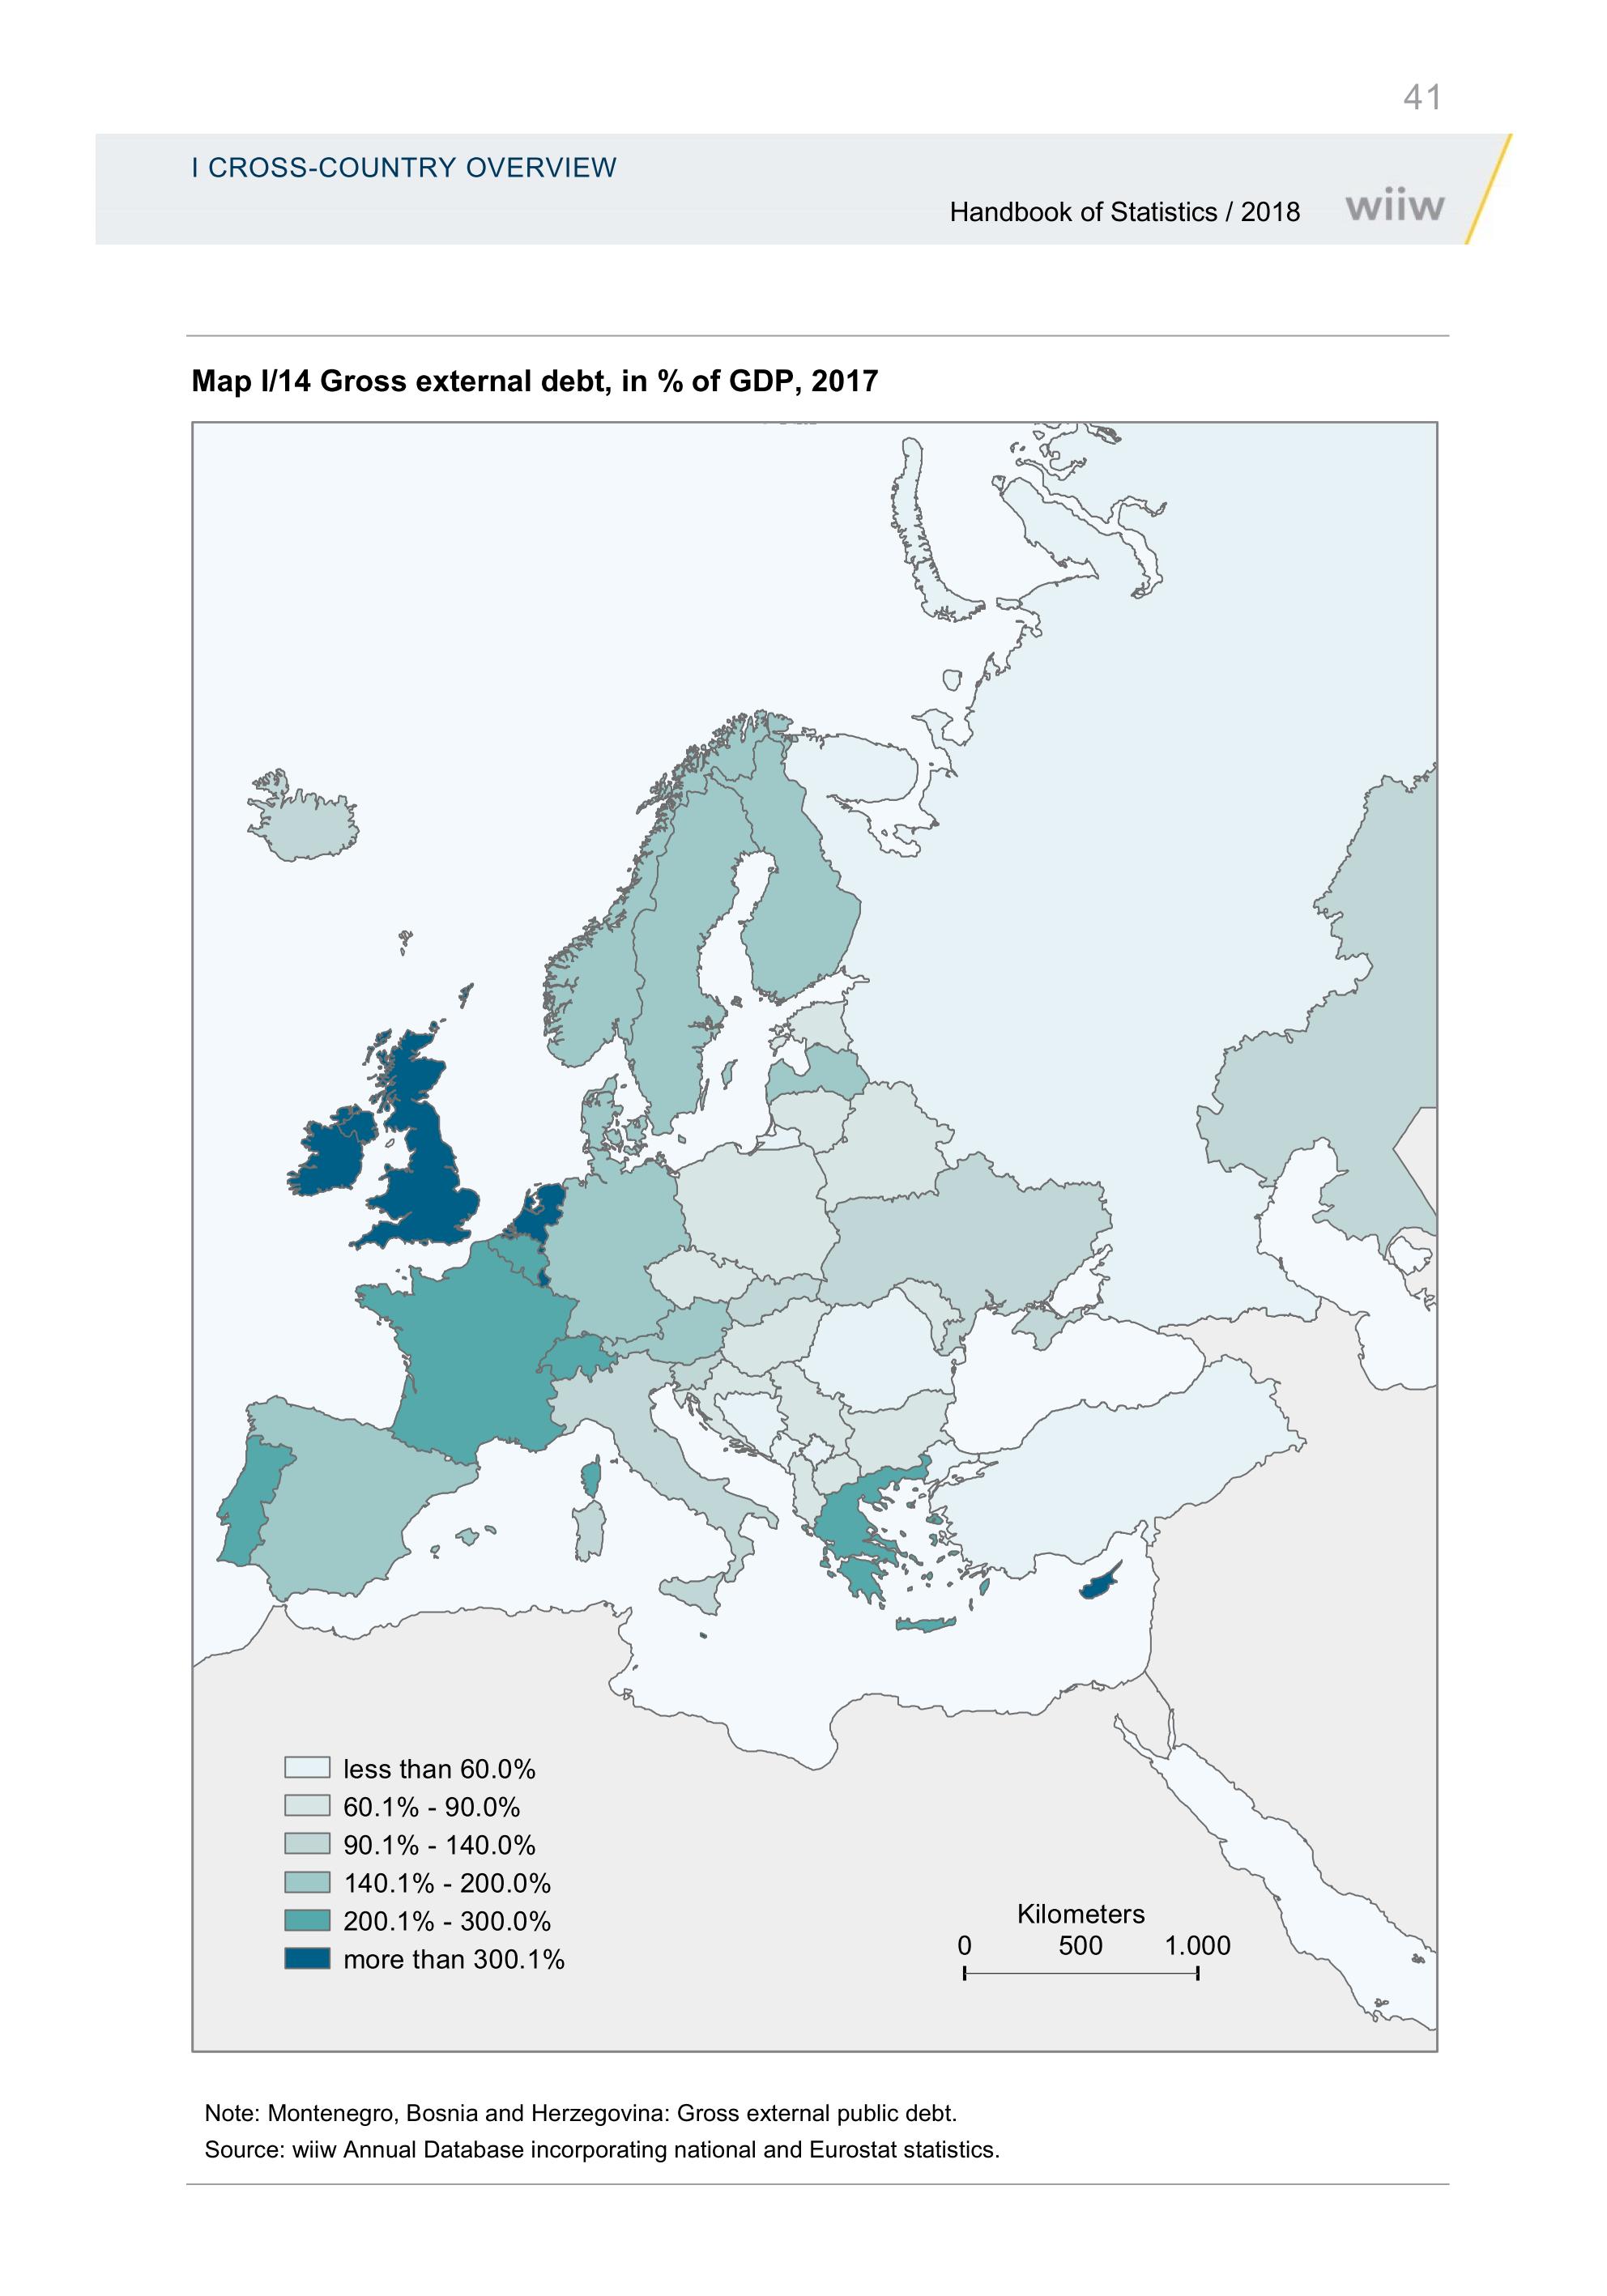
In the CESEE region gross external debt as a share of GDP declined substantially in 2017 compared to 2016, but has still not reached its pre-crisis level. However not only the magnitude of debt but also its structure by currency and maturity, as well as foreign exchange rate regime, are determinants for the assessment of each country‘s vulnerability to external borrowing risks.

Among individual countries Kosovo with 33.2% and Russia with 31% external debt to GDP ratios are least dependent on foreign borrowing. Latvia, Slovenia and Slovakia have external debt levels of more than 100% of GDP, but borrow in euros and thus high exposures are mitigated by low interest rates. Among countries combining high external indebtedness in dollars and flexible exchange rate regimes, which makes them vulnerable to interest rates rise and currency risks, Ukraine with 97.3% and Kazakhstan with 97.2% external debt to GDP ratios are most exposed to risks.
Detailed statistics on external debt comparisons: Chapter I. Cross-country overview, Table I/26 / Gross external debt, % of GDP
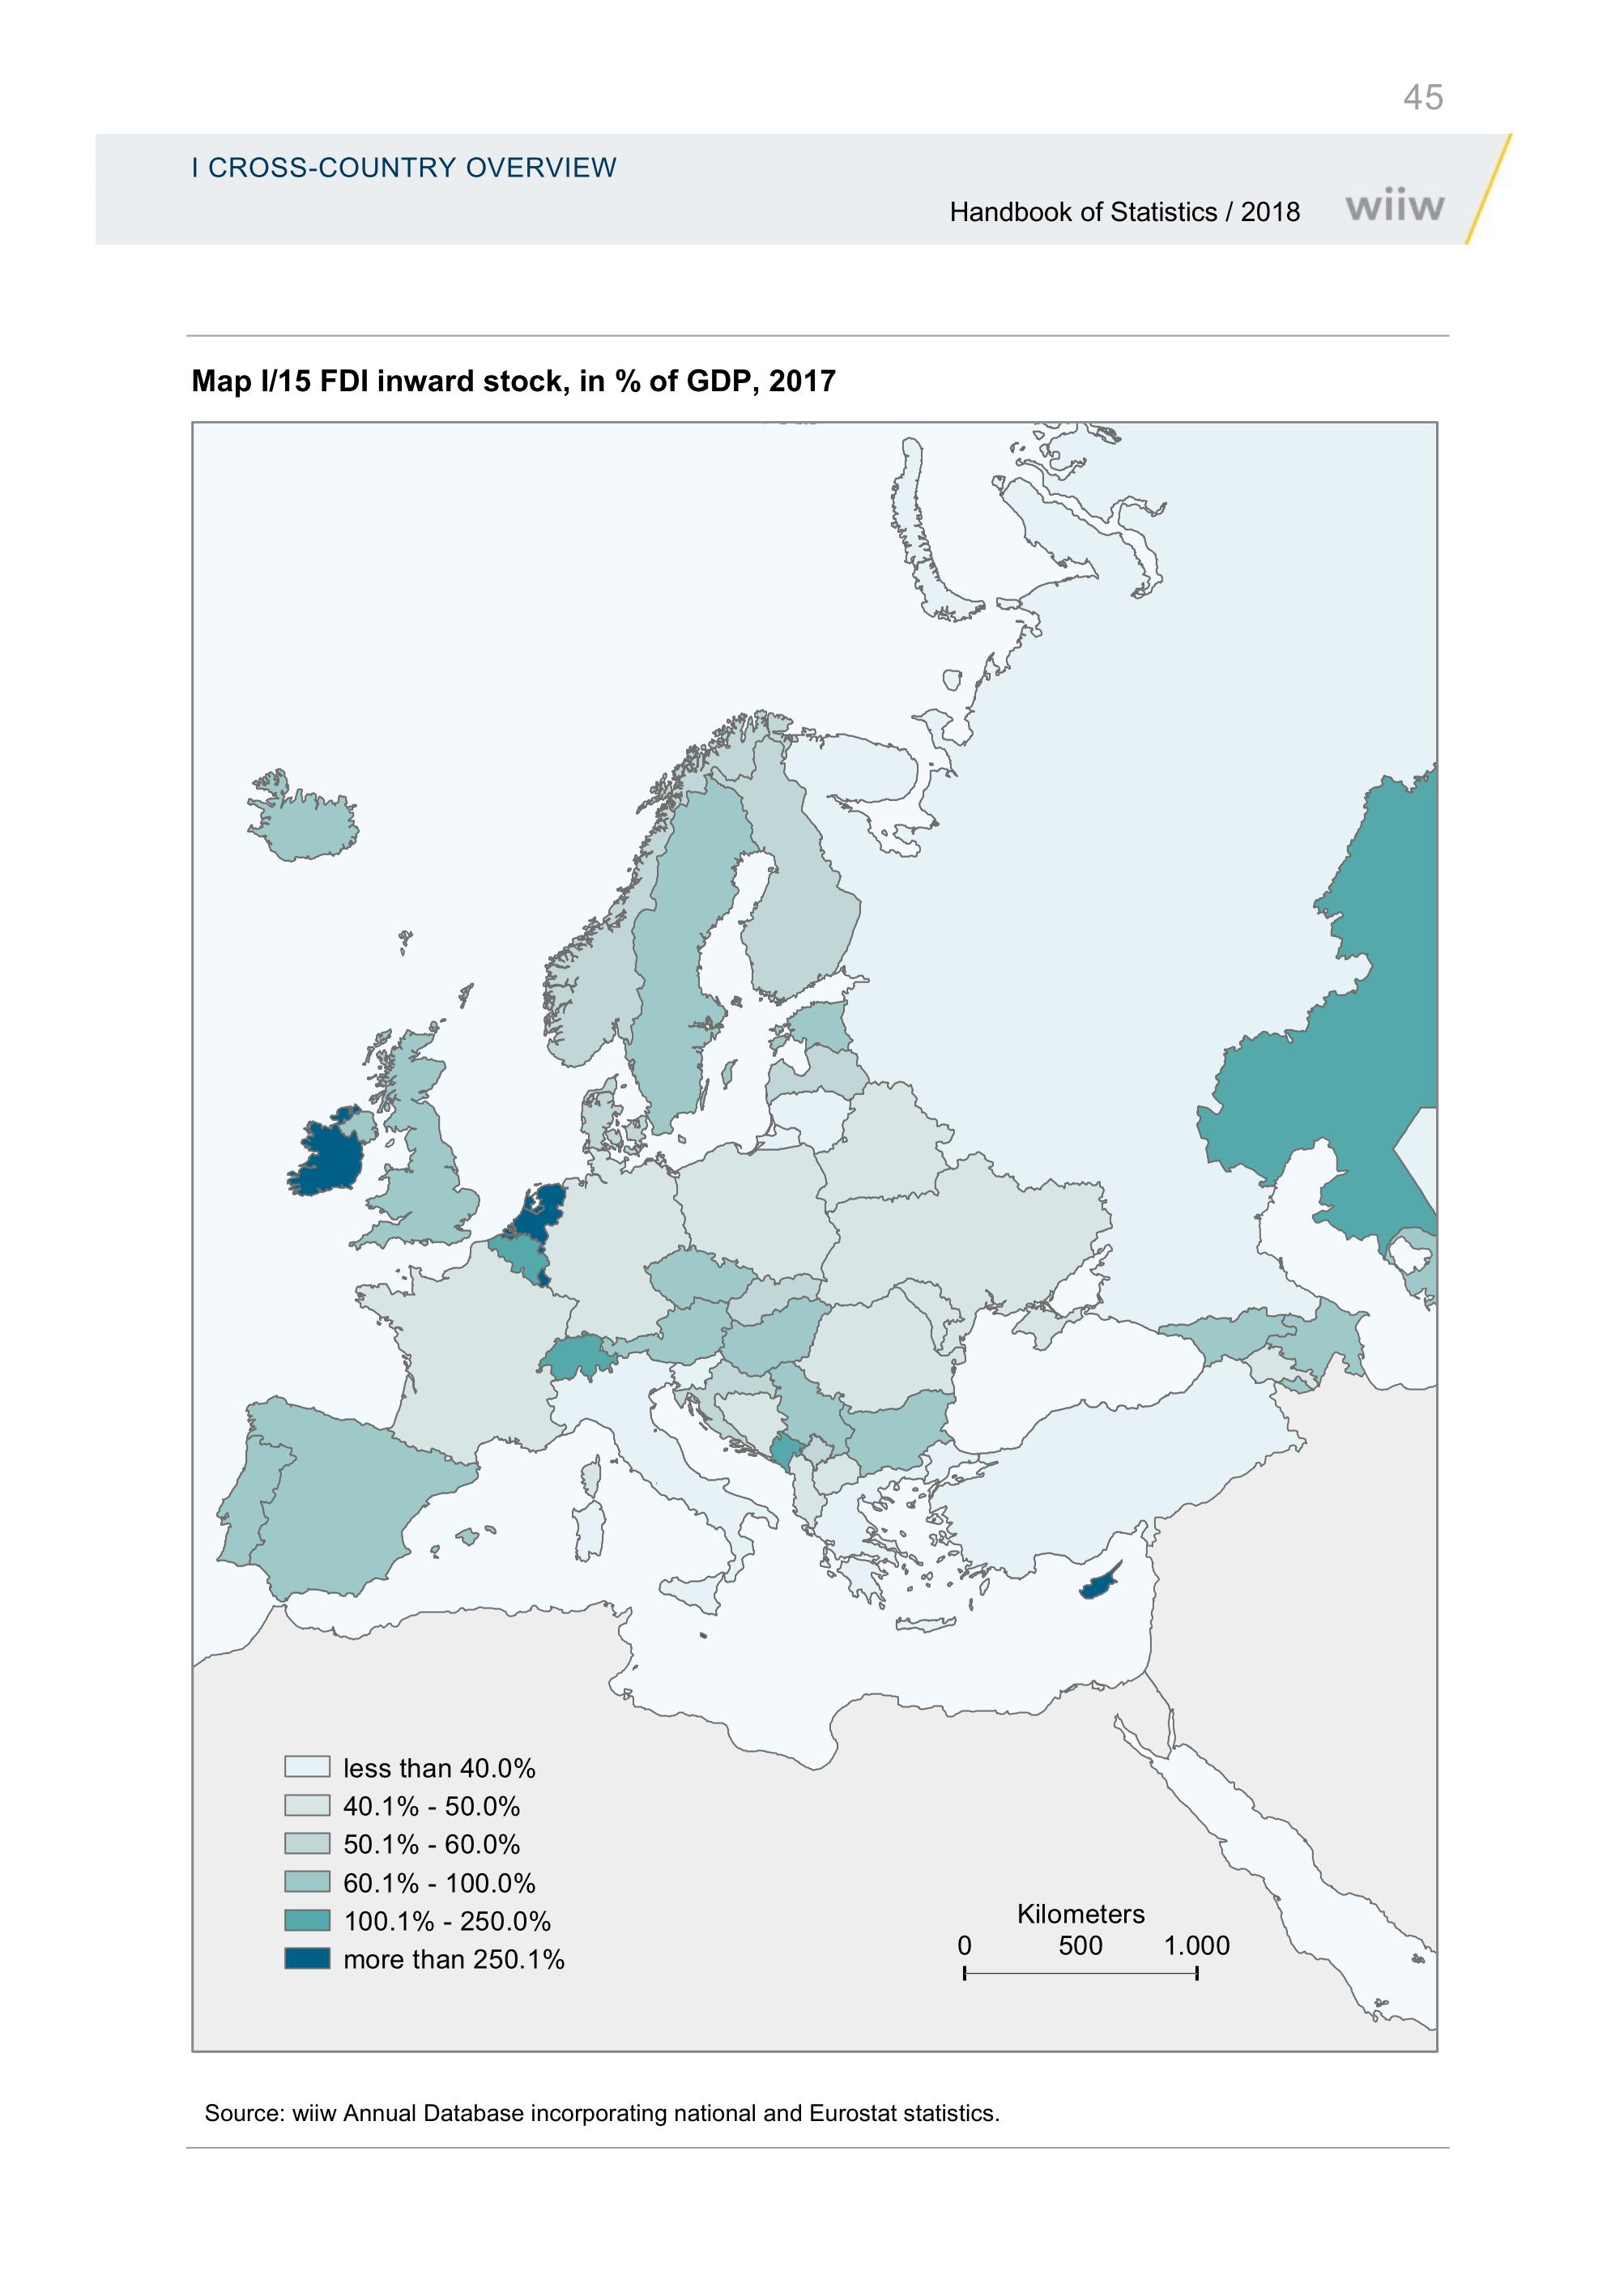
FDI in CESEE has increased in recent years. Albania, Turkey, the Czech Republic and Poland expanded their inward FDI stocks more than 10% in 2017. In the same year, only Belarus, Hungary, Kazakhstan, Russia and Ukraine experienced decline in the stock of inward FDI. Traditionally being the important source of investment for many countries, further FDI growth is now conditional on development in the global economy and unit labour costs in CESEE.
For many countries, the infrastructure-related FDI needed to modernise their economies is yet to realise. The share of FDI stocks in infrastructure - related industries is less than 15% in 19 out of 22 CESEE countries (the exceptions are Albania, Turkey, Bosnia and Herzegovina). Low ICT - related FDI shares indicate untapped potential which could be unlocked as the new digital economy develops.
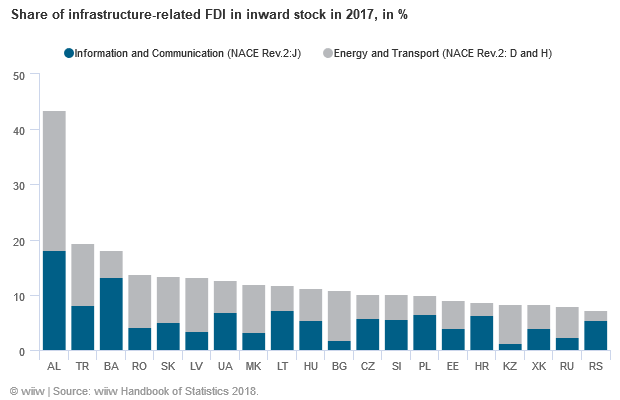
More data on FDI inward stock: Chapter III. Structural indicators - 8. FDI inward stock
The share of persons employed in ICT, one of the indicators highlighting the rise of the new digital economy, is below 3% for most CESEE economies, except Estonia (4.7%), Slovenia (3.5%) and Latvia (3.2%). Some countries of the region have recently experienced high employment growth in this sector of the economy. Data for 2017 show high growth rates of the employment in ICT for Kosovo (30.1%), Montenegro (20 %) and Latvia (18.9%). On average over a 5-year period, the highest growth rates have been observed in Serbia (14.6%), Estonia (10.9%) and Kosovo (6.6%).
Further details
Countries covered: Albania, Belarus, Bosnia and Herzegovina, Bulgaria, Croatia, Czech Republic, Estonia, Hungary, Kazakhstan, Kosovo, Latvia, Lithuania, Macedonia, Montenegro, Poland, Romania, Russia, Serbia, Slovakia, Slovenia, Turkey, Ukraine.
Country groupings: CESEE countries
The wiiw Handbook of Statistics is available in hardcopy with the most recent years and in Excel format covering the whole period.
The present issue of the Handbook represents the 24th volume in this statistical publication series.